Fig. 1
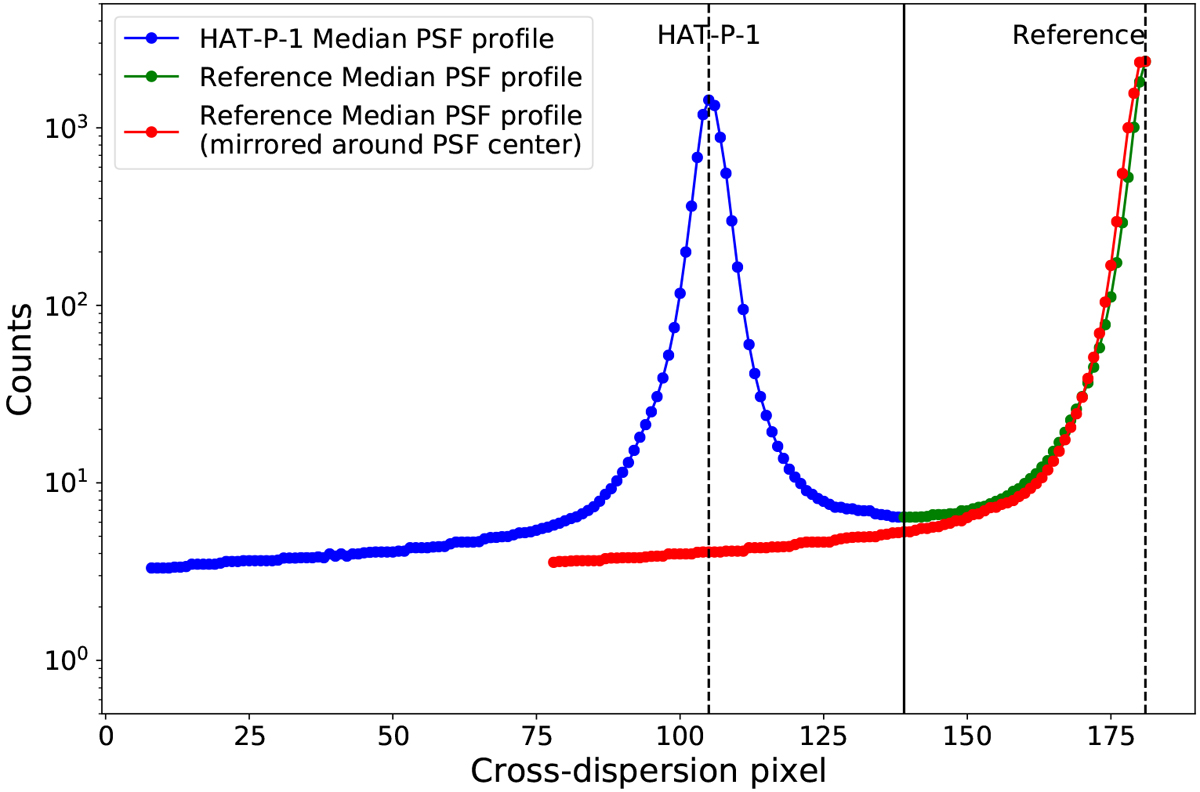
Median PSF profiles of the target and the reference star from the R150 data. The B600 observations look similar. We have mirrored the reference star PSF profile around its peak (green and red) in order to illustrate our method of correcting for diluted light. The black line indicates the point where we separate the two spectra. Because we have ensured that the single-star PSFs observed with GMOS are symmetric, we can use the mirrored part of the PSF to estimate the amount of contamination on the target PSF. We also correct the reference star for diluted light from the target in a similar way. We extrapolate the red curve linearly for regions beyond the spatial range of the observation. The boundary (black line) we select between the target and reference stars was fixed as a function of time, although the spectral trace evolves withairmass and gravity vector on the instrument. However, this can be arbitrary (as long as it is reasonable) because the exact location of the boundary does not affect the amount of scattered light from the reference diluting the target flux extracted from the core of the target PSF. This is measured only using the opposite wing of the reference PSF, which is not affected by our choice of border.
Current usage metrics show cumulative count of Article Views (full-text article views including HTML views, PDF and ePub downloads, according to the available data) and Abstracts Views on Vision4Press platform.
Data correspond to usage on the plateform after 2015. The current usage metrics is available 48-96 hours after online publication and is updated daily on week days.
Initial download of the metrics may take a while.