Fig. 8.
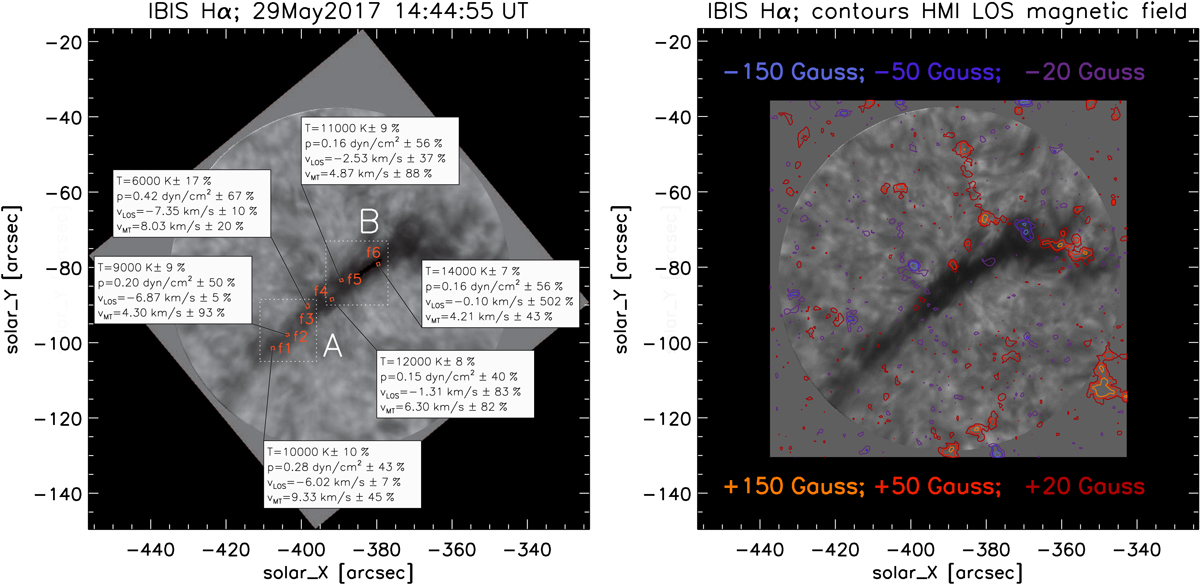
Intensity map of the observed fragment of the filament with schematically shown plasma parameters derived for individual areas f1–f6 using the forward modelling shown in the left panel. In the right panel, the intensity map overplotted with contours of the LOS magnetic field of −150, −50, −25, +25, +50, and +150 Gauss measured by the SDO/HMI instrument.
Current usage metrics show cumulative count of Article Views (full-text article views including HTML views, PDF and ePub downloads, according to the available data) and Abstracts Views on Vision4Press platform.
Data correspond to usage on the plateform after 2015. The current usage metrics is available 48-96 hours after online publication and is updated daily on week days.
Initial download of the metrics may take a while.