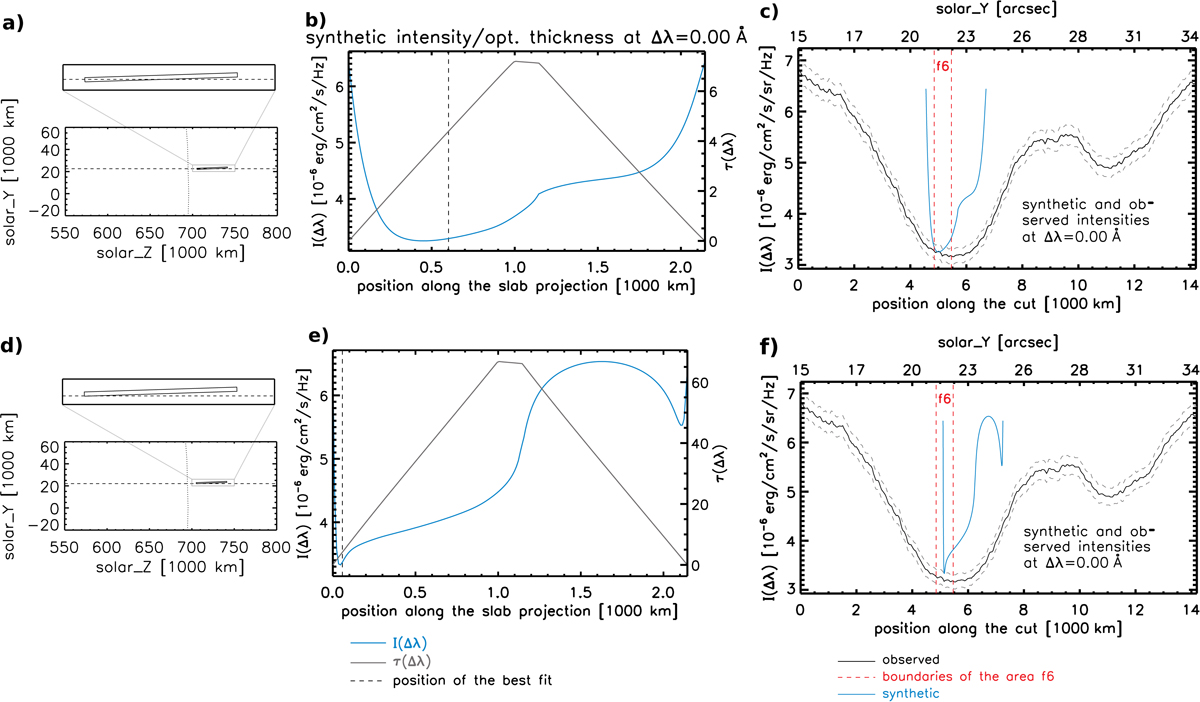
Fig. 7.

Example of behaviour of the model and comparison of resulted synthetic intensities with observations for area f6. In the upper row we show the results of a model with the gas pressure of 0.08 dyn cm−2 and in the bottom row the results of a model with the gas pressure of 0.25 dyn cm−2. The spectral intensities I(λ) in the plots in panels b, c, e, and f are expressed in units of 10−6 erg cm−2 s−1 Hz−1. Comparing panels a–c with panels d–f one can see that for results of the modelling obtained with rather different values of gas pressure, there exist synthetic profiles for both models which agree well with the observed profile within errors of its measured spectral intensities (in panels c and f shown only for Δλ = 0 Å), although those synthetic profiles occur in radiation emergent from different positions along the projected slab. More details about the plots shown in the figure are given in the text of Sect. 5.2.
Current usage metrics show cumulative count of Article Views (full-text article views including HTML views, PDF and ePub downloads, according to the available data) and Abstracts Views on Vision4Press platform.
Data correspond to usage on the plateform after 2015. The current usage metrics is available 48-96 hours after online publication and is updated daily on week days.
Initial download of the metrics may take a while.


