Fig. 6.
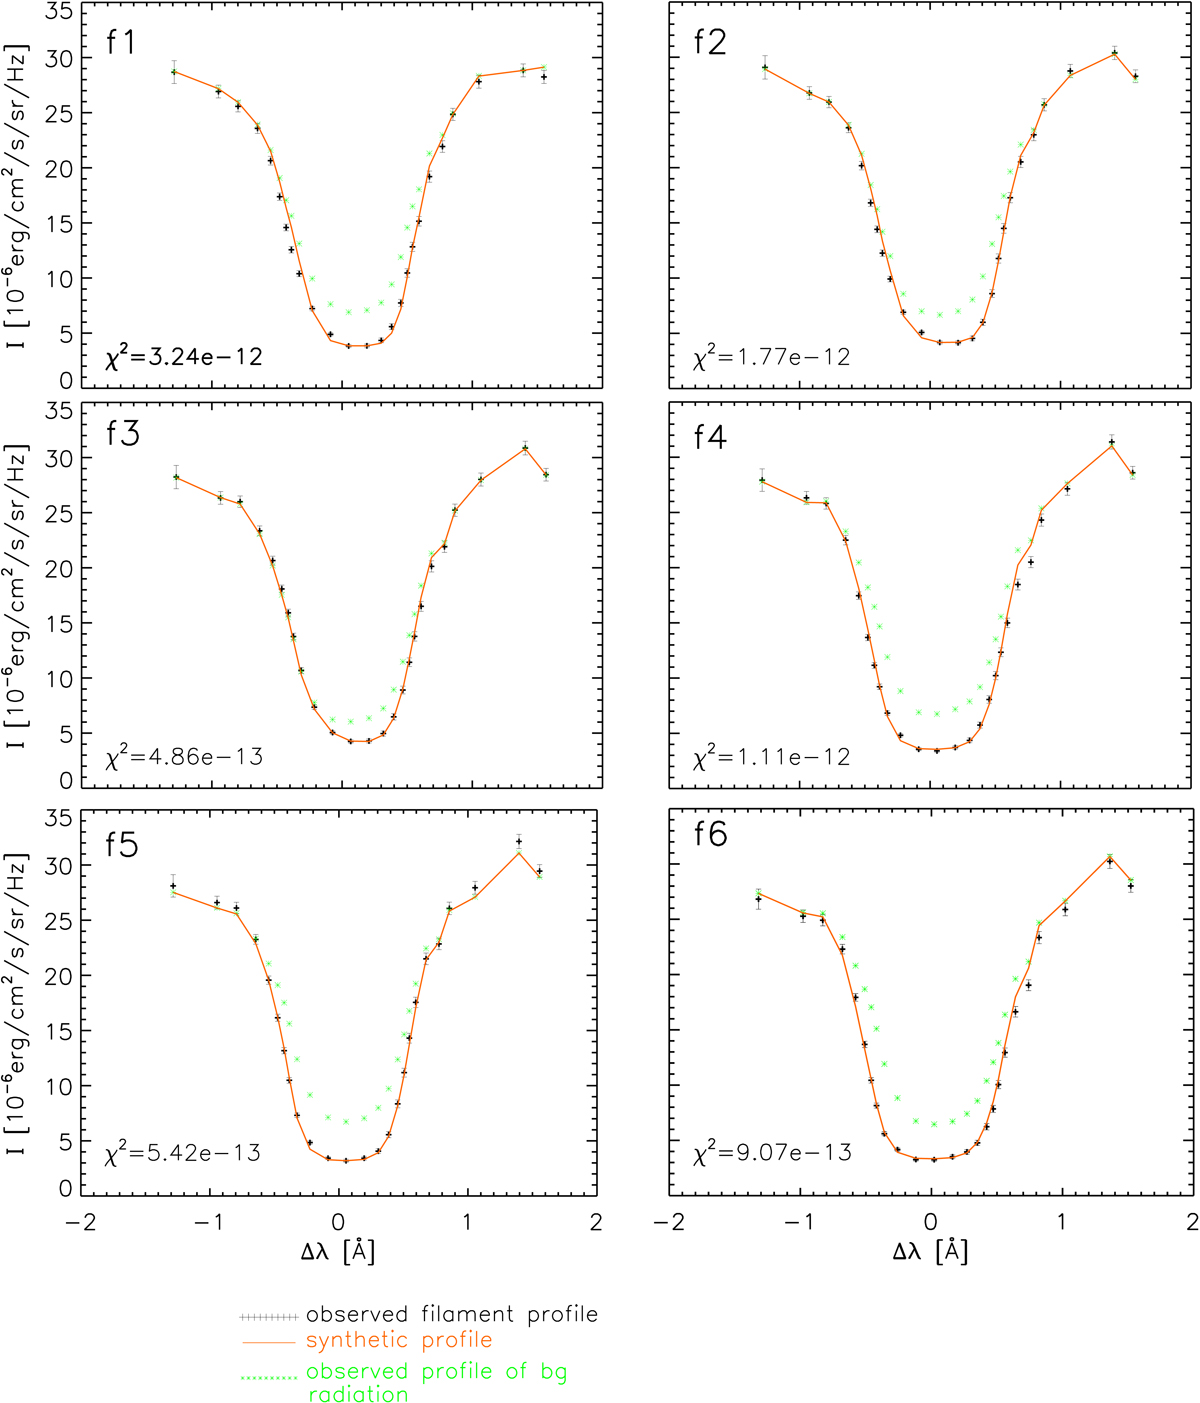
Comparison of the best synthetic profiles (red lines) of the resulting models with observed profiles (black “+” symbols with error bars) for the six areas f1–f6. The profiles from six associated QS areas q1–q6 used as the background irradiation of the slab in the formal solution are plotted by the green asteriscs. In each plot the χ2 value of the synthetic profile fitting to the observed one is also presented.
Current usage metrics show cumulative count of Article Views (full-text article views including HTML views, PDF and ePub downloads, according to the available data) and Abstracts Views on Vision4Press platform.
Data correspond to usage on the plateform after 2015. The current usage metrics is available 48-96 hours after online publication and is updated daily on week days.
Initial download of the metrics may take a while.