Fig. 3.
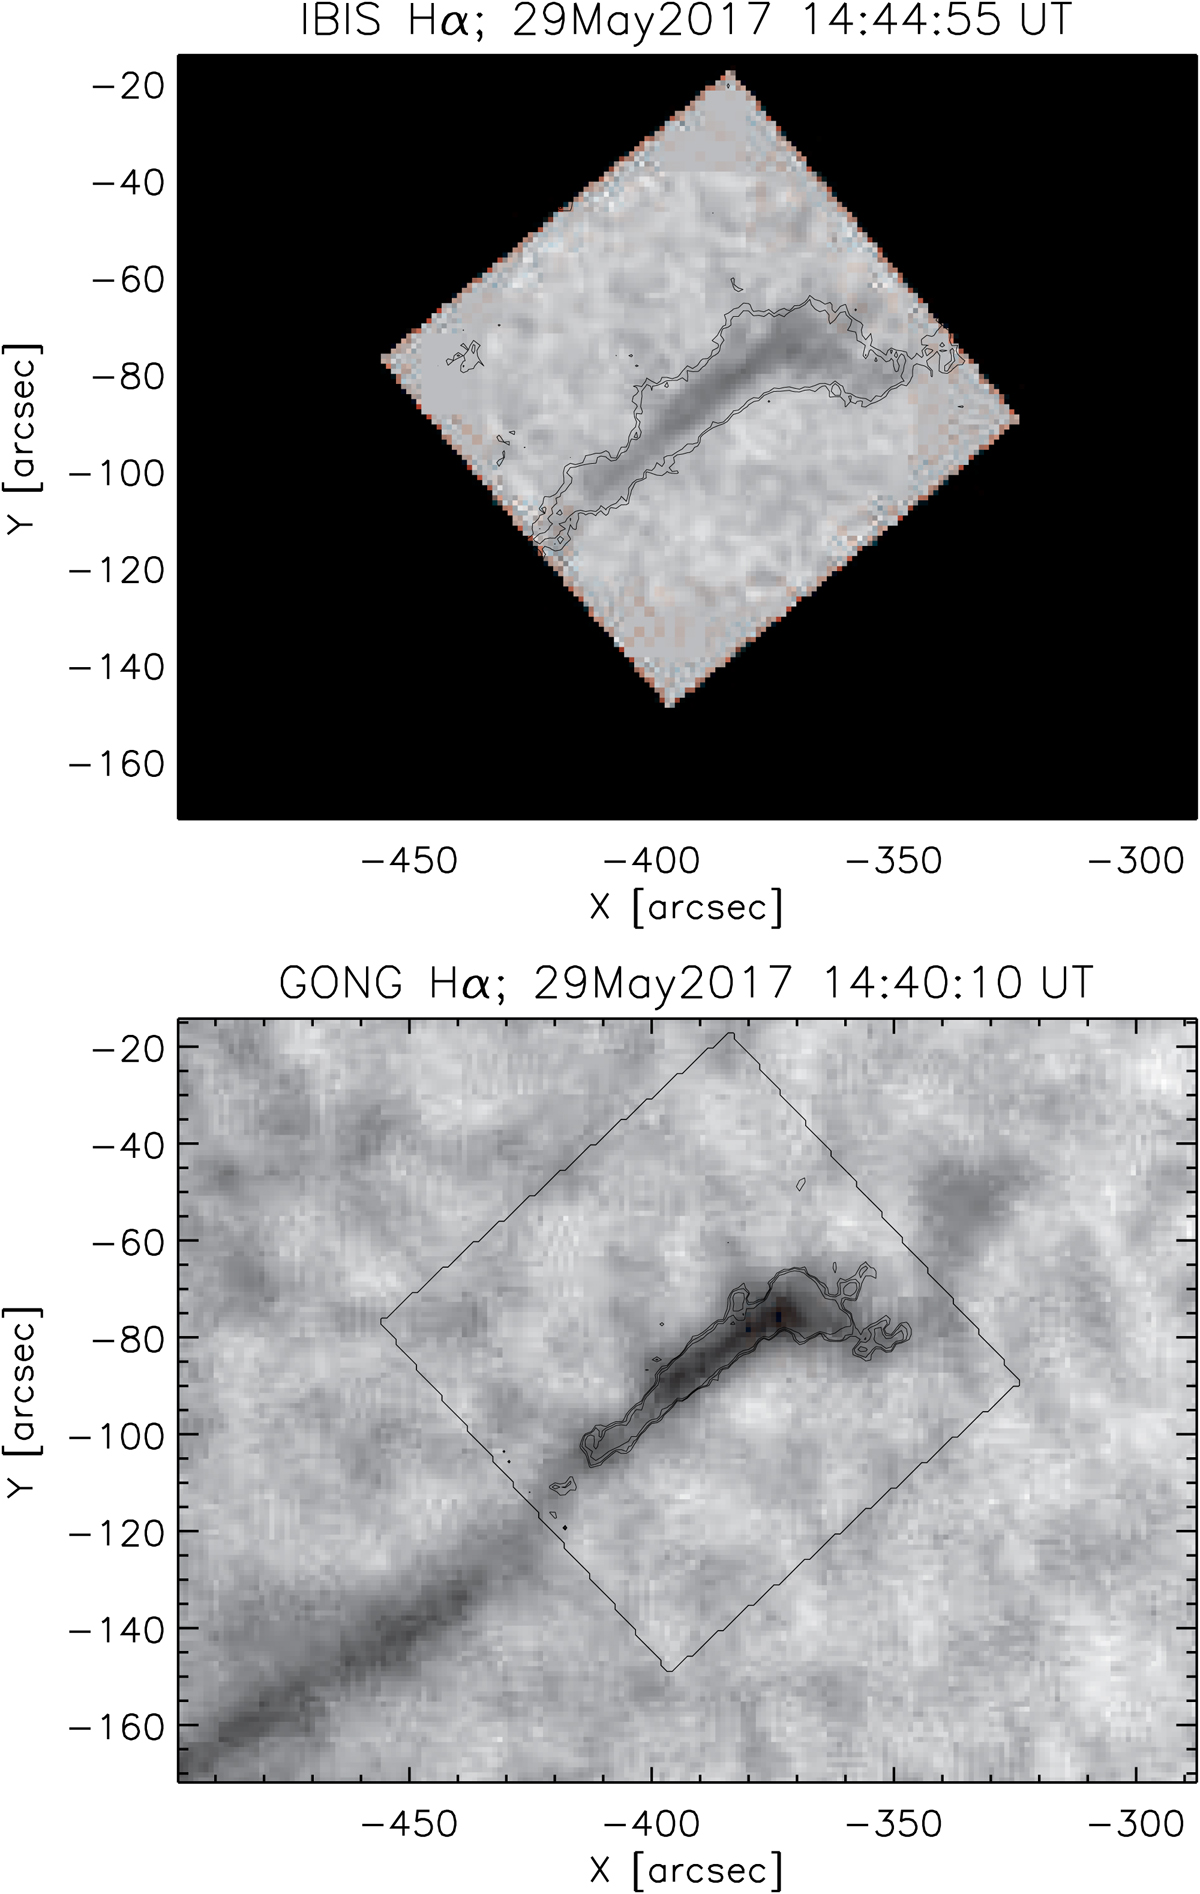
Co-alignment of the IBIS Hα data (top) with the full-disk Hα observations obtained by GONG (bottom). The black square in the bottom panel marks the FOV of the IBIS observations. Contours plotted in the GONG image outline the IBIS intensity map and vice versa. Any difference in contrast at the filament as seen in these two images are caused by different transmission of both instruments.
Current usage metrics show cumulative count of Article Views (full-text article views including HTML views, PDF and ePub downloads, according to the available data) and Abstracts Views on Vision4Press platform.
Data correspond to usage on the plateform after 2015. The current usage metrics is available 48-96 hours after online publication and is updated daily on week days.
Initial download of the metrics may take a while.