Fig. 2.
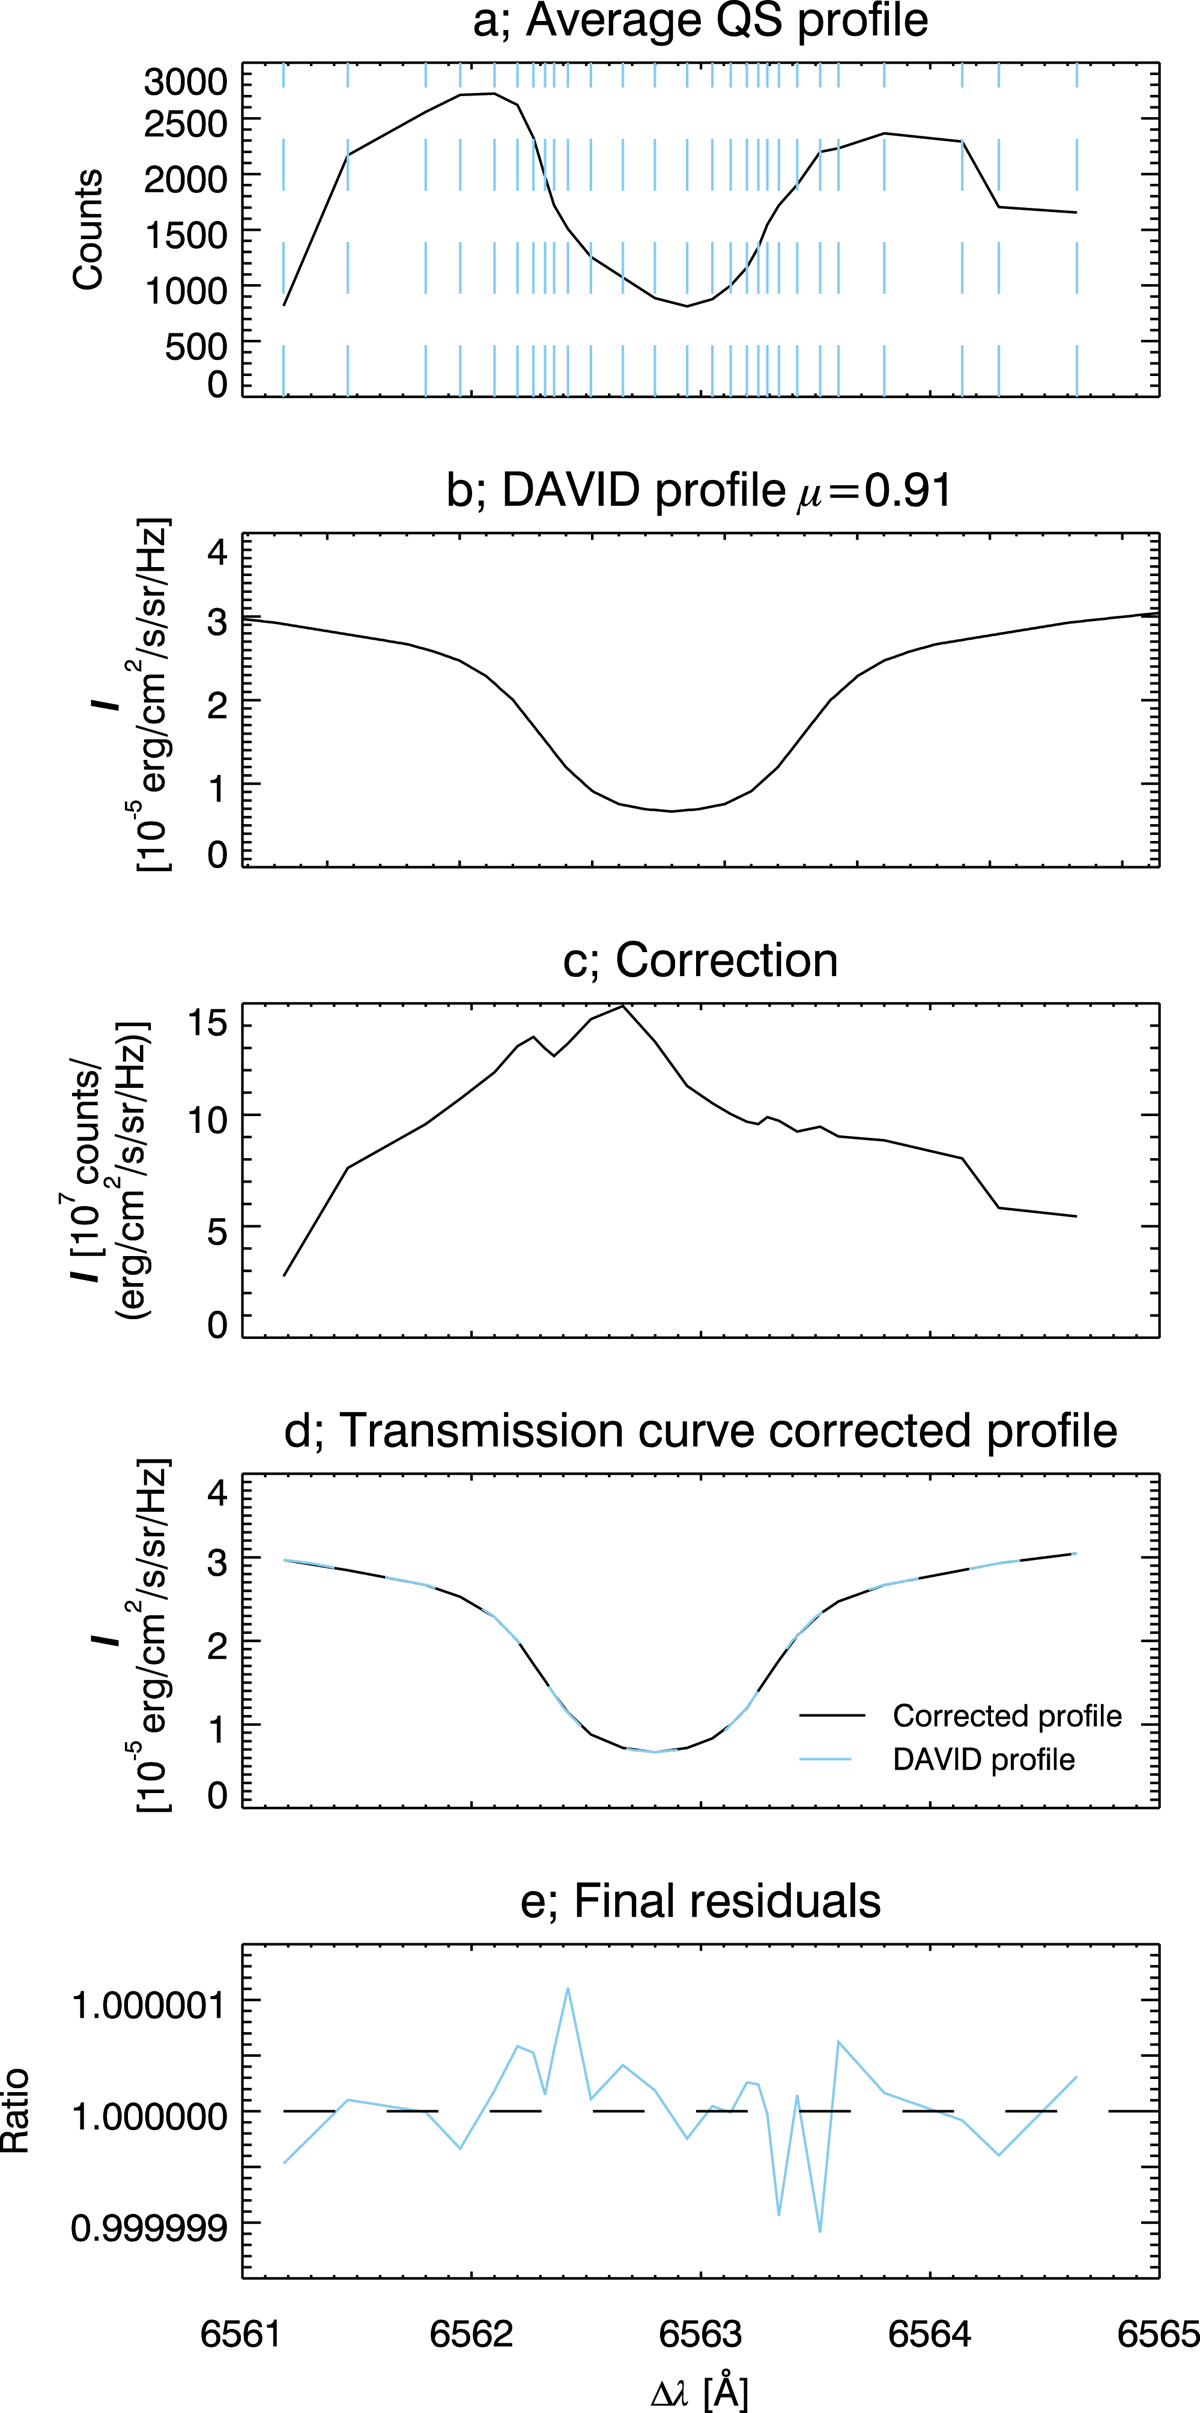
Illustration of the pre-filter correction method using the Hα tables of David (1961). Panel a: average QS profile calculated from the area marked in Fig. 1c. Vertical dashed lines indicate 27 IBIS wavelength positions used. Panel b: reference David’s Hα profile at μcal = 0.91. Panel c: correction between panels a and b. Panel d: average QS profile with panel c correction applied, and panel b over-plotted in dashed-line. Panel e: residuals remaining between the corrected profile and the reference profile.
Current usage metrics show cumulative count of Article Views (full-text article views including HTML views, PDF and ePub downloads, according to the available data) and Abstracts Views on Vision4Press platform.
Data correspond to usage on the plateform after 2015. The current usage metrics is available 48-96 hours after online publication and is updated daily on week days.
Initial download of the metrics may take a while.