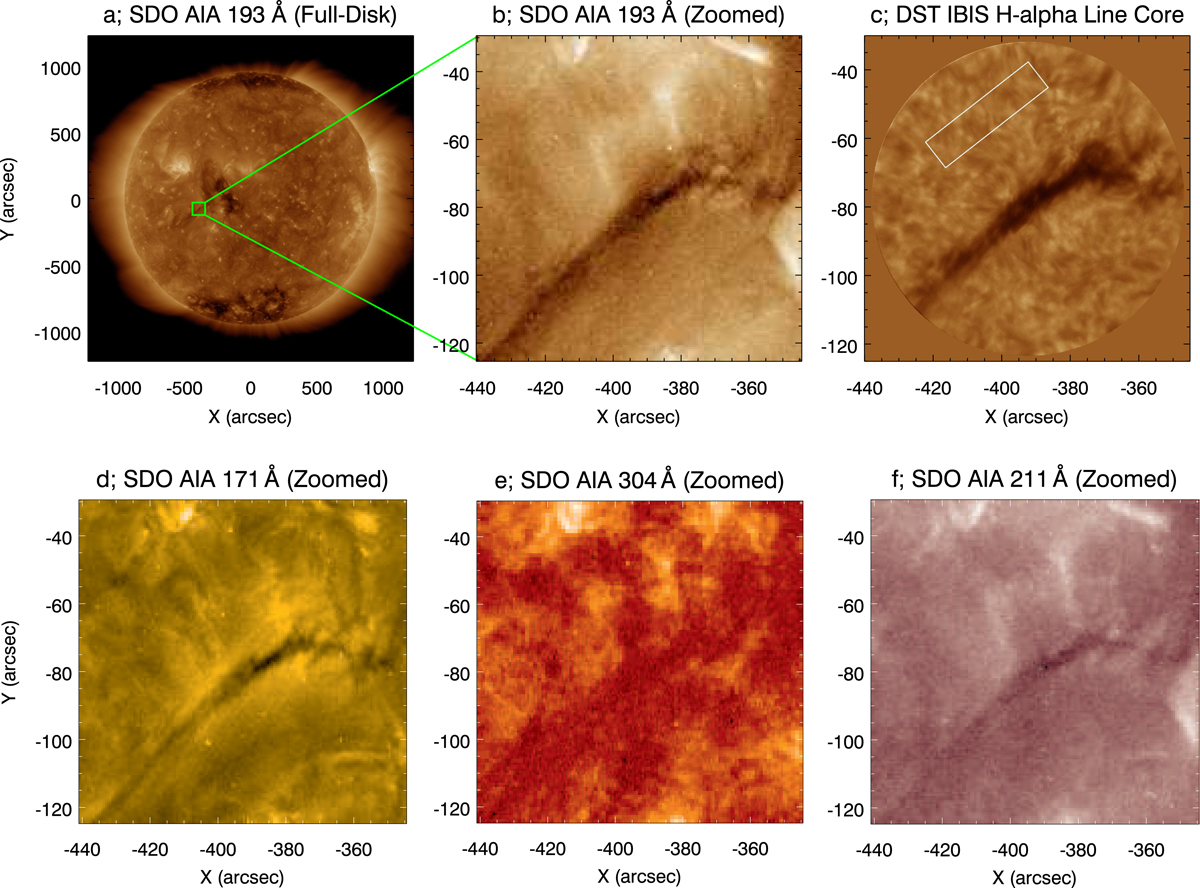
Fig. 1.

Filament observed on May 29, 2017. Panel a: context full-disk image in the SDO/AIA 193 Å channel. Panel b: zoom-in on the box marked in the panel a. Panel c: Hα line core image of the filament taken by DST/IBIS at 14:44:55 UT. White box indicates the region from which the average quiet-Sun profile was calculated. Panel d–f: contextual SDO/AIA images in three EUV channels: 171 Å, 304 Å, and 211 Å. The images have the same zoomed-in field of view as is in panel b.
Current usage metrics show cumulative count of Article Views (full-text article views including HTML views, PDF and ePub downloads, according to the available data) and Abstracts Views on Vision4Press platform.
Data correspond to usage on the plateform after 2015. The current usage metrics is available 48-96 hours after online publication and is updated daily on week days.
Initial download of the metrics may take a while.


