Fig. 6.
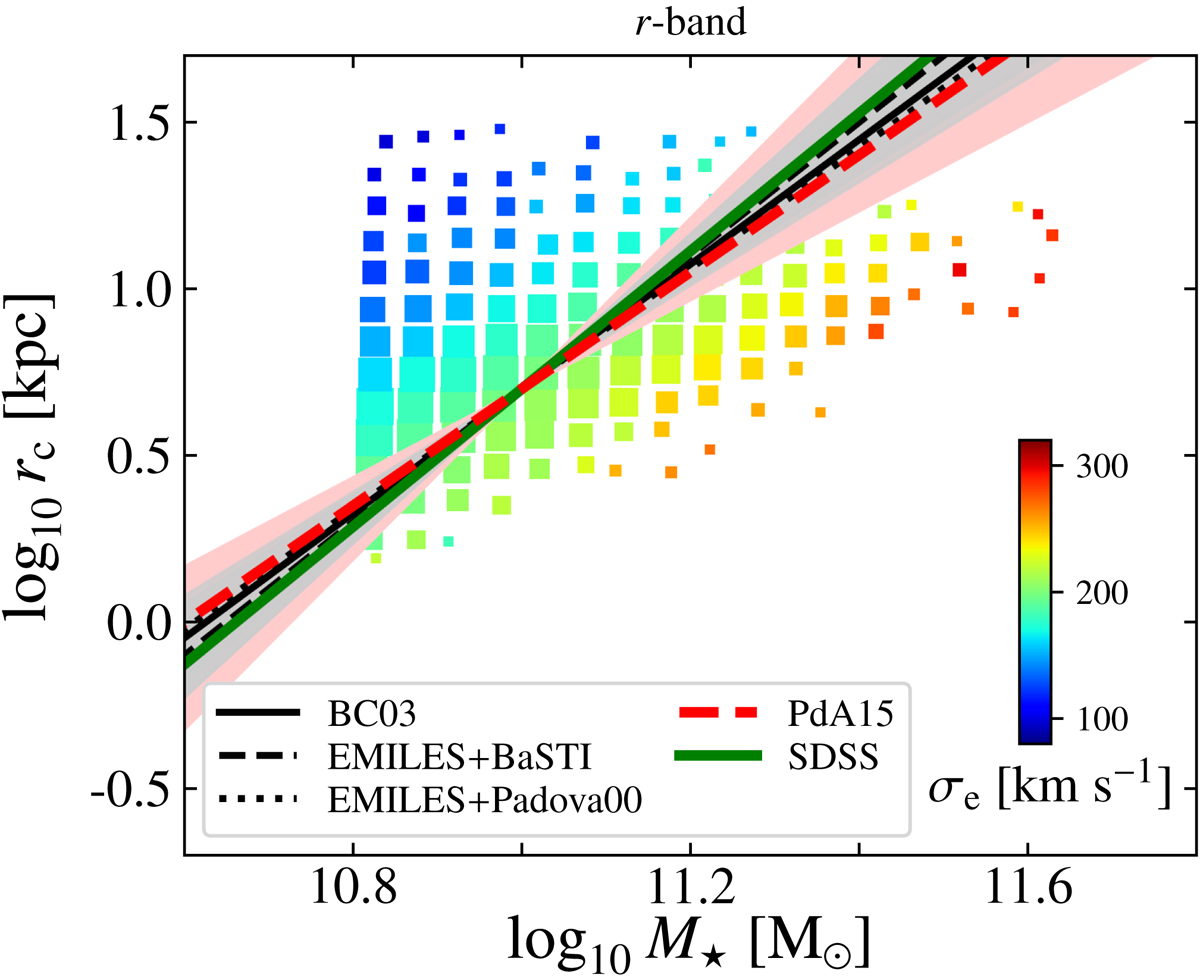
Average values of the velocity dispersion in the stellar mass–size plane for quiescent galaxies from the SDSS at 0.02 ≤ z ≤ 0.08 for the r band. The size of the marker illustrates the number of galaxies in each bin, and its colour illustrates the average velocity dispersion at one effective radius (see colour bar). Black lines show the empirical relation of constant formation epochs (Eq. (3)) obtained for BC03, EMILES+BaSTI, and EMILES+Padova00 SSP models (solid, dashed, and dotted black lines, respectively). Curves of constant velocity dispersions for one effective radius using SDSS data and the results from Peralta de Arriba et al. (2015) are illustrated with green and red lines, respectively. For each case, the shaded areas show the uncertainties in the fits of constant galaxy properties.
Current usage metrics show cumulative count of Article Views (full-text article views including HTML views, PDF and ePub downloads, according to the available data) and Abstracts Views on Vision4Press platform.
Data correspond to usage on the plateform after 2015. The current usage metrics is available 48-96 hours after online publication and is updated daily on week days.
Initial download of the metrics may take a while.