Fig. 9.
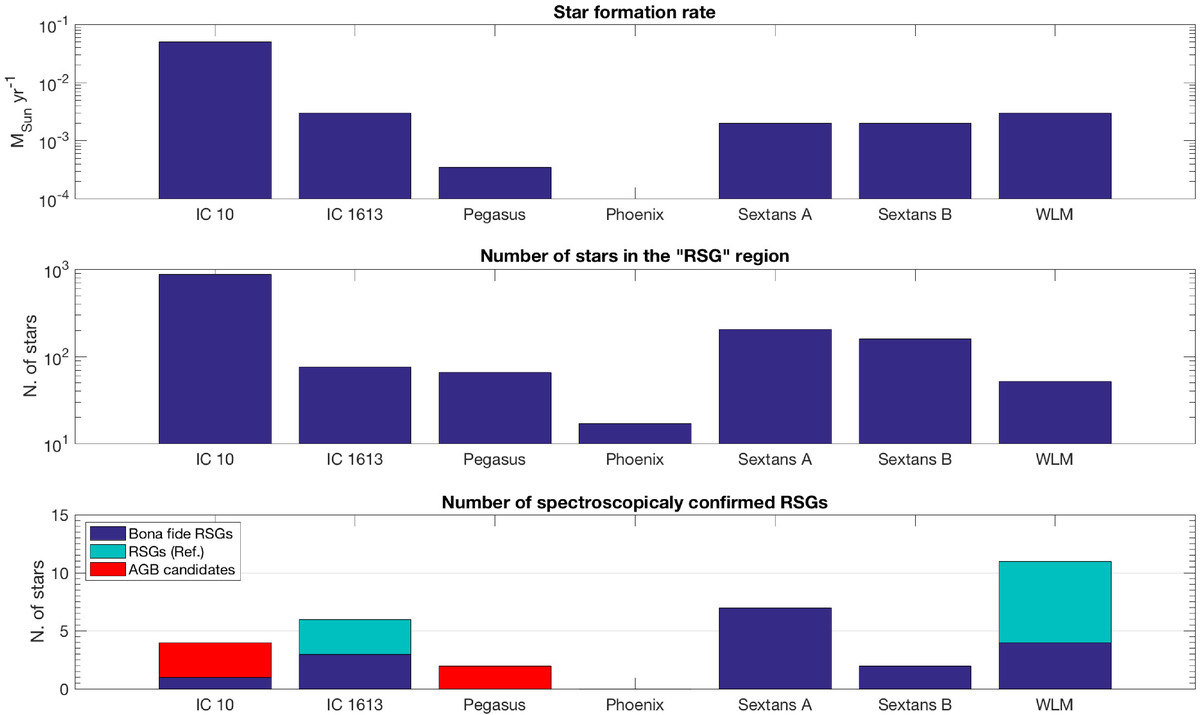
Total number of discovered RSGs in each dIrr galaxy (bottom panel), total number of sources in the RSG region, i.e., [3.6]−[4.5]< 0 and M[3.6] < −9 (middle panel), and SFR estimate in each dIrr galaxy (top panel). The number of AGB candidates and the number of RSGs that have been identified by other authors (Tautvaišienė et al. 2007; Levesque & Massey 2012) are labeled.
Current usage metrics show cumulative count of Article Views (full-text article views including HTML views, PDF and ePub downloads, according to the available data) and Abstracts Views on Vision4Press platform.
Data correspond to usage on the plateform after 2015. The current usage metrics is available 48-96 hours after online publication and is updated daily on week days.
Initial download of the metrics may take a while.