Fig. 6.
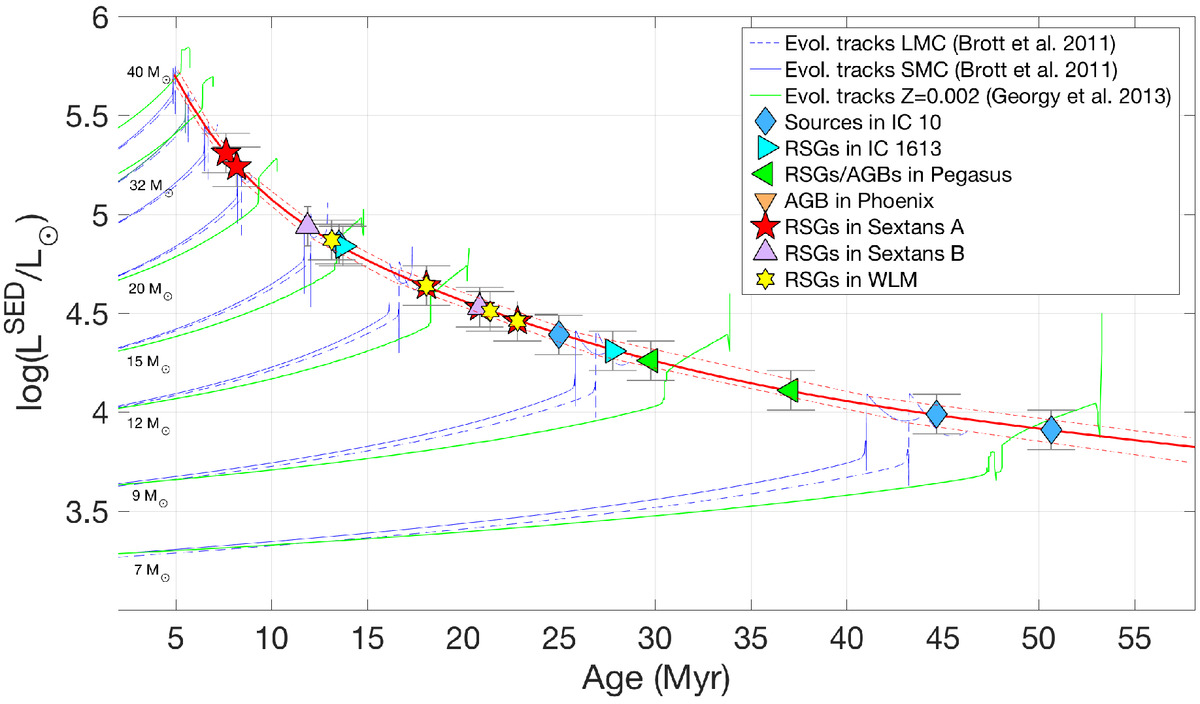
Luminosity-age diagram for the RSG region based on the LMC and SMC evolutionary tracks (Brott et al. 2011), together with the evolutionary tracks from Georgy et al. (2013). The evolutionary stage of the RSG region, i.e., the He-burning phase, is marked by the red dashed lines. The solid red line corresponds to the weighted polynomial fit of the He-burning phase based on the SMC evolutionary tracks.
Current usage metrics show cumulative count of Article Views (full-text article views including HTML views, PDF and ePub downloads, according to the available data) and Abstracts Views on Vision4Press platform.
Data correspond to usage on the plateform after 2015. The current usage metrics is available 48-96 hours after online publication and is updated daily on week days.
Initial download of the metrics may take a while.