Fig. 5.
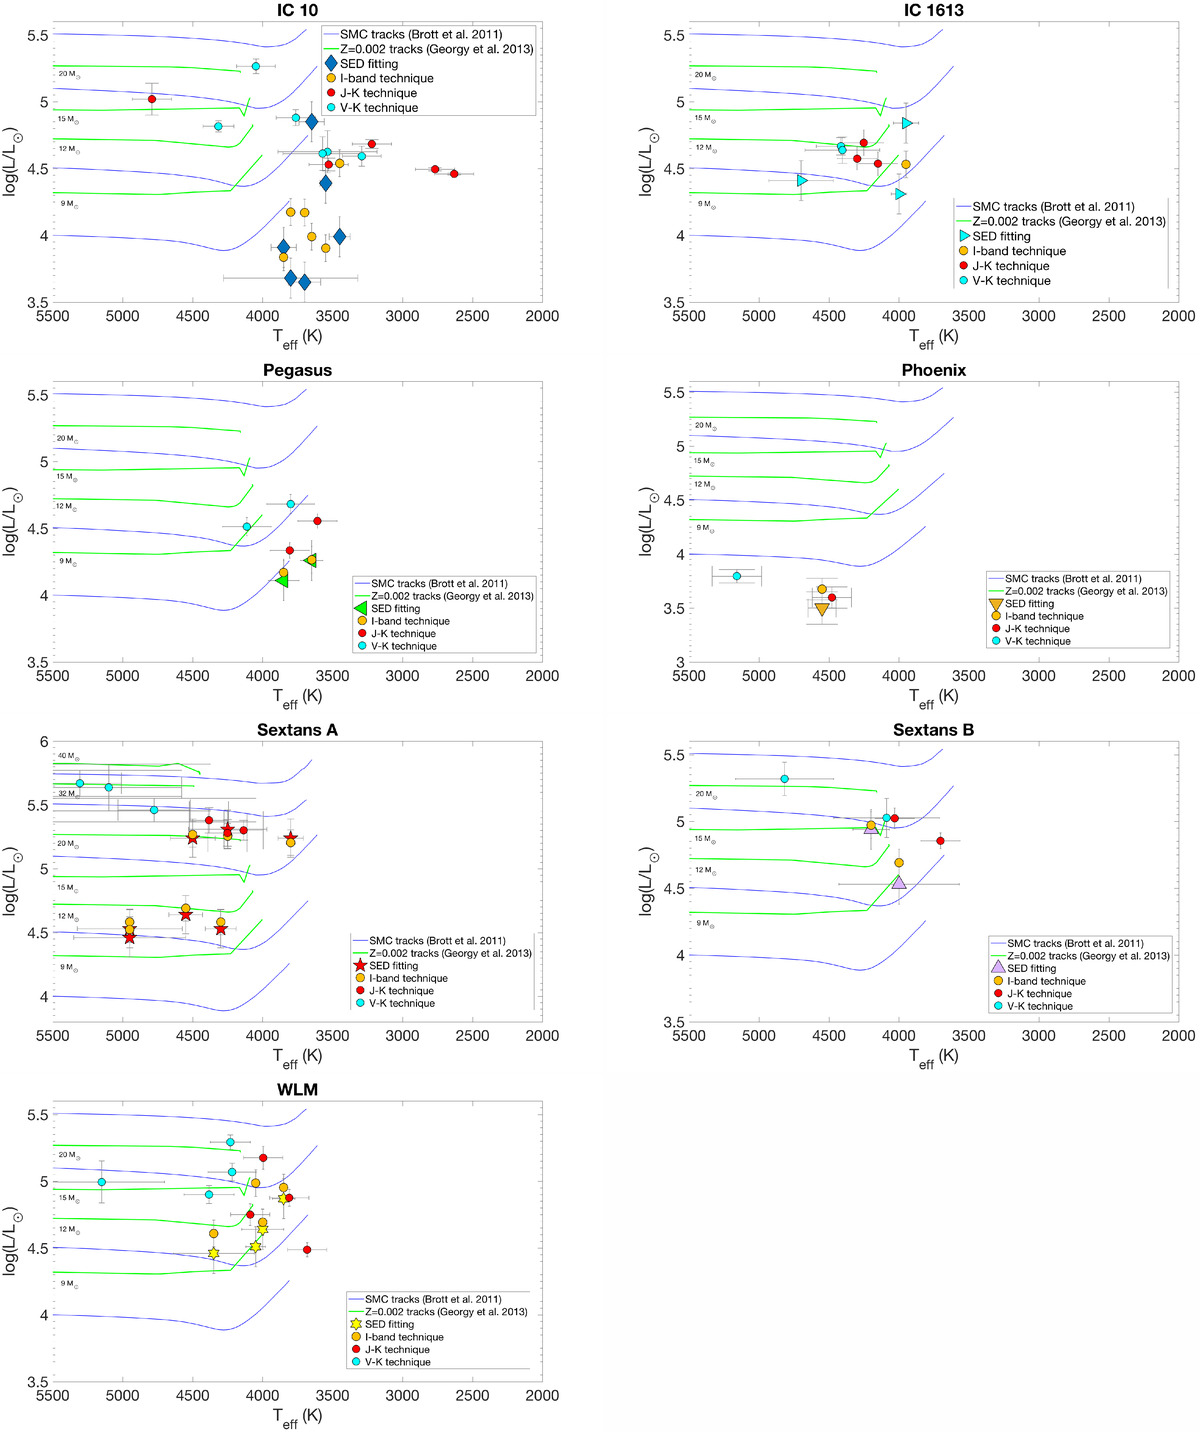
Red supergiant region of the Hertzsprung–Russell diagram for all identified RSG candidates in each program galaxy compared with the evolutionary tracks from Brott et al. (2011) for the SMC metallicity and the evolutionary tracks from Georgy et al. (2013) for Z = 0.002. For each target we present the results obtained from different techniques: the SED technique (![]() , LSED), I-band technique (
, LSED), I-band technique (![]() , L(I−band)), J − K technique (
, L(I−band)), J − K technique (![]() , L(J − K)), and the V − K technique (
, L(J − K)), and the V − K technique (![]() , L(V − K)).
, L(V − K)).
Current usage metrics show cumulative count of Article Views (full-text article views including HTML views, PDF and ePub downloads, according to the available data) and Abstracts Views on Vision4Press platform.
Data correspond to usage on the plateform after 2015. The current usage metrics is available 48-96 hours after online publication and is updated daily on week days.
Initial download of the metrics may take a while.