Fig. 1.
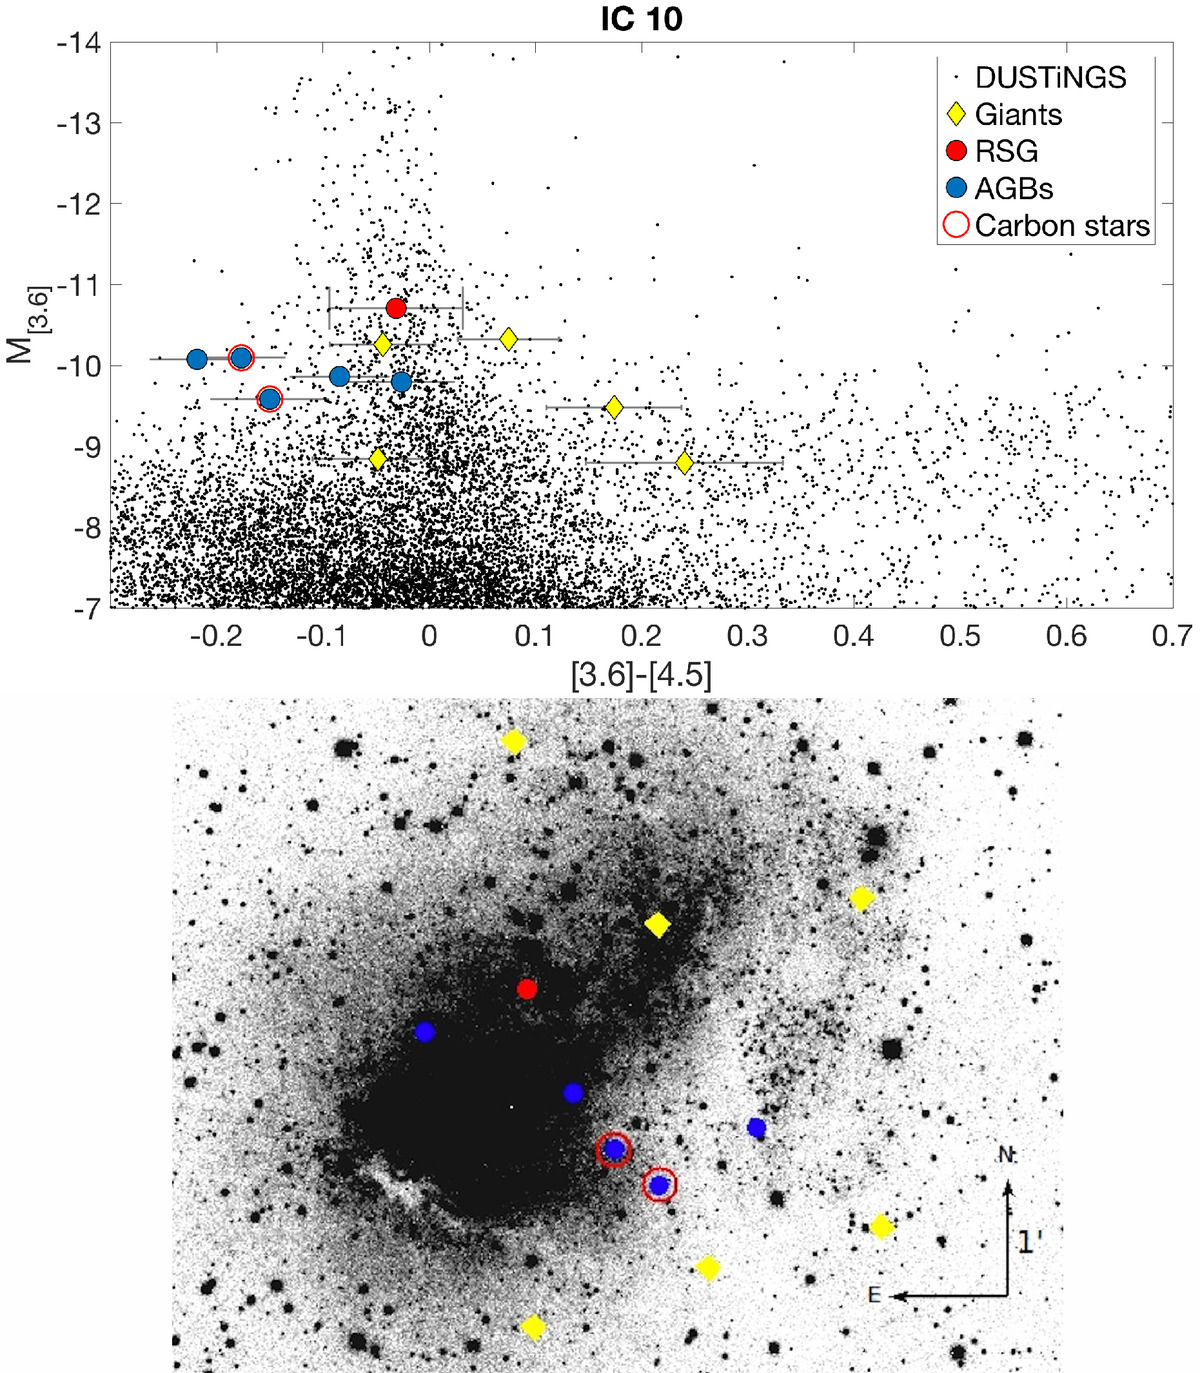
Top panel: M[3.6] vs. [3.6]−[4.5] CMD for the dIrr galaxy IC 10. Observed stars are labeled with different symbols according to their classification, see Table A.1. The foreground late-type giant stars are labeled “giant”. The error bars for colors and magnitudes are shown with gray lines. Bottom panel: spatial distribution of the observed targets, superposed on V-band images of the galaxy IC 10 (Massey et al. 2007a).
Current usage metrics show cumulative count of Article Views (full-text article views including HTML views, PDF and ePub downloads, according to the available data) and Abstracts Views on Vision4Press platform.
Data correspond to usage on the plateform after 2015. The current usage metrics is available 48-96 hours after online publication and is updated daily on week days.
Initial download of the metrics may take a while.