Fig. 7.
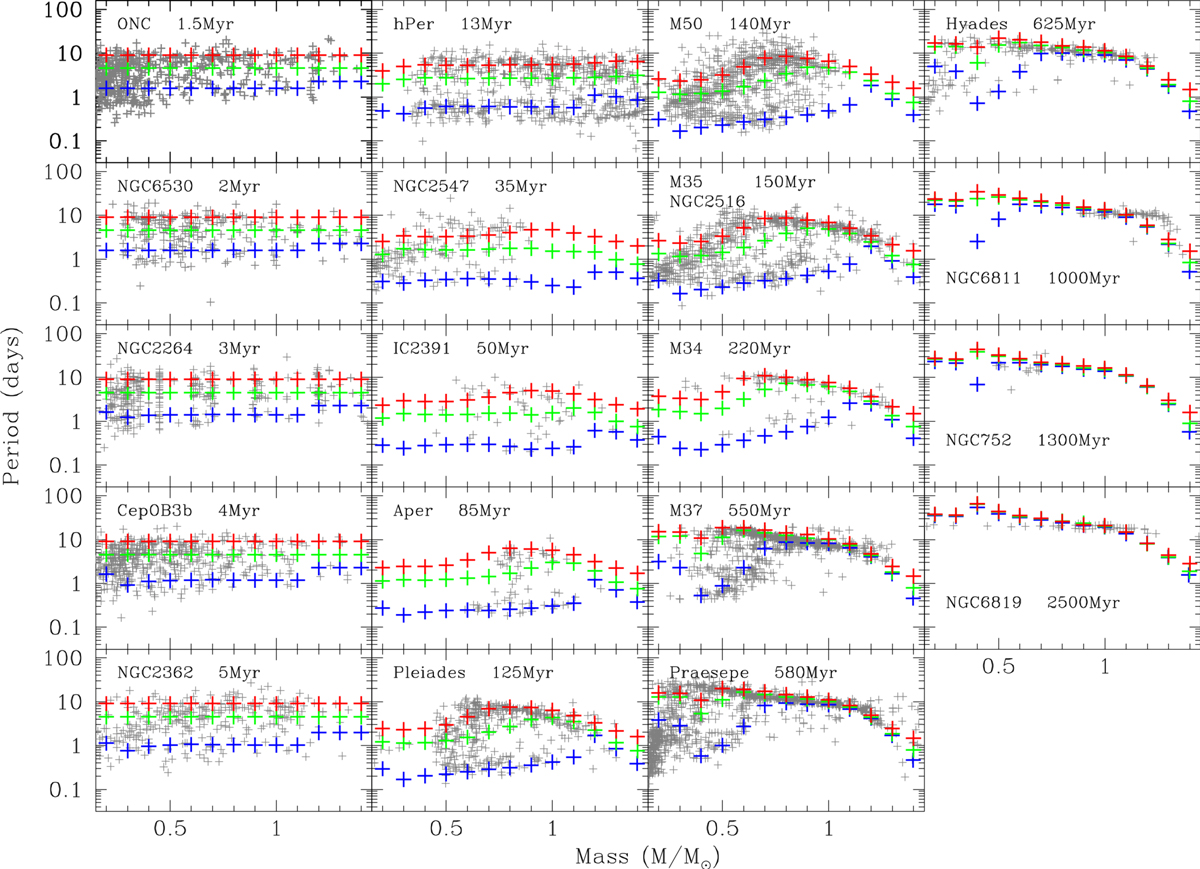
Comparison over the whole mass range, between 0.2 and 1.5 M⊙, of the rotation period distributions of our solar metallicity models with observations from open clusters of increasing ages (grey crosses, data from Gallet & Bouvier 2013; Bouvier et al. 2014; Douglas et al. 2016, 2017; Agüeros et al. 2018). The red, green, and blue crosses represent the rotation periods of the slow-, median-, and fast-rotating grids, respectively. Masses and ages of cluster members are taken from the literature.
Current usage metrics show cumulative count of Article Views (full-text article views including HTML views, PDF and ePub downloads, according to the available data) and Abstracts Views on Vision4Press platform.
Data correspond to usage on the plateform after 2015. The current usage metrics is available 48-96 hours after online publication and is updated daily on week days.
Initial download of the metrics may take a while.