Fig. 5.
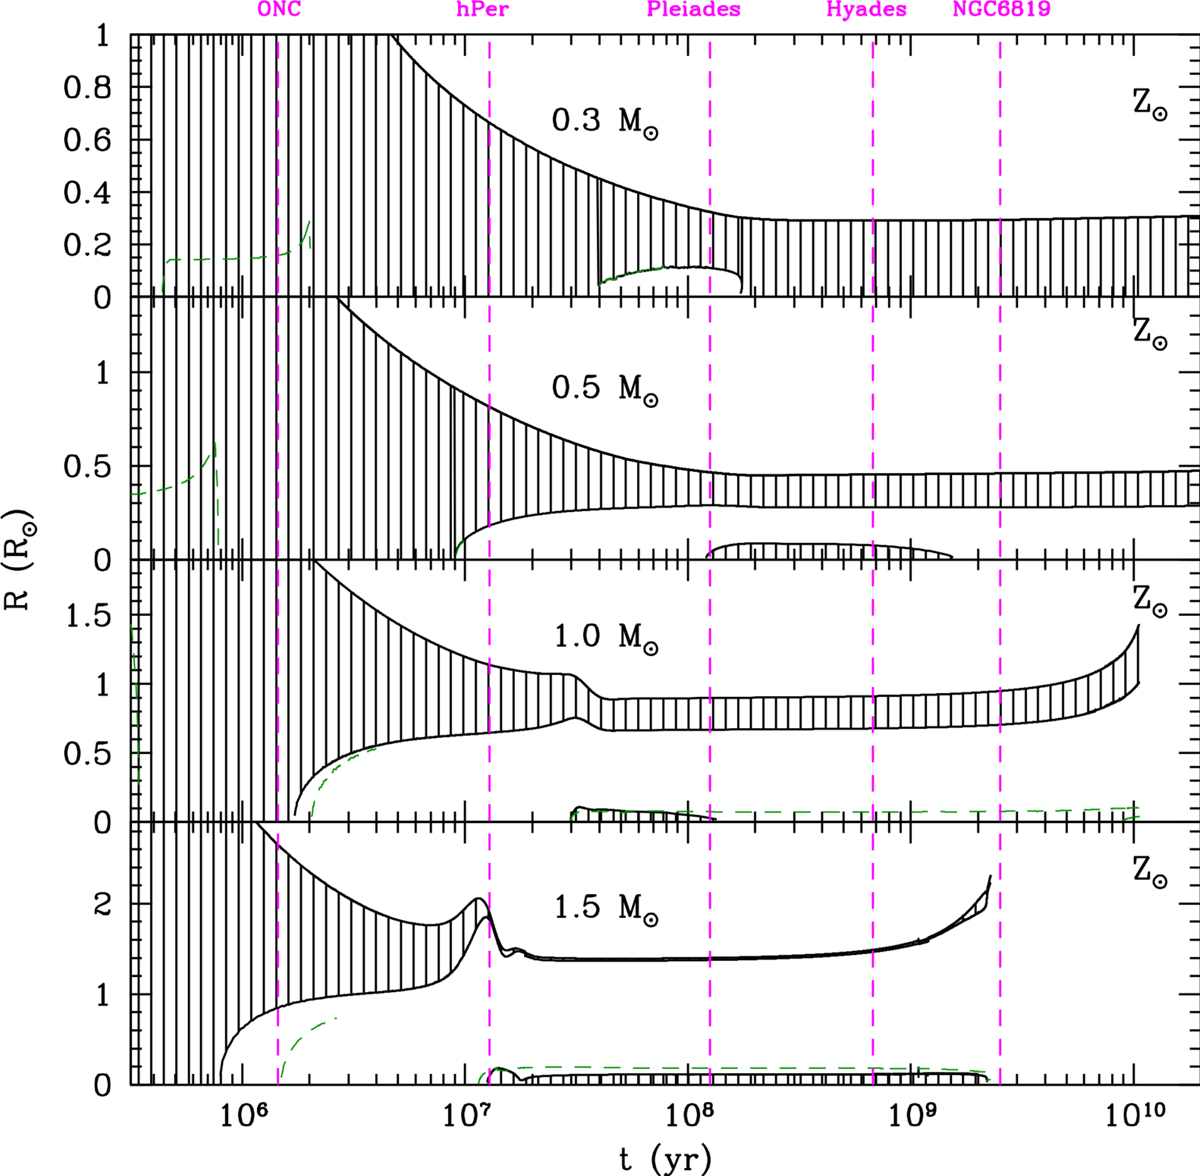
Kippenhahn diagram showing the evolution of the internal structure of the non-rotating solar metallicity models of 0.3 (top), 0.5, 1.0 and 1.5 M⊙ (bottom) from the PMS up to the end of the main sequence. The upper line represents the surface radius and hatched areas refer to convective regions. The green line displays the H-burning limit. The five pink vertical lines indicate the ages of open clusters used as markers of the evolution.
Current usage metrics show cumulative count of Article Views (full-text article views including HTML views, PDF and ePub downloads, according to the available data) and Abstracts Views on Vision4Press platform.
Data correspond to usage on the plateform after 2015. The current usage metrics is available 48-96 hours after online publication and is updated daily on week days.
Initial download of the metrics may take a while.