Fig. 4.
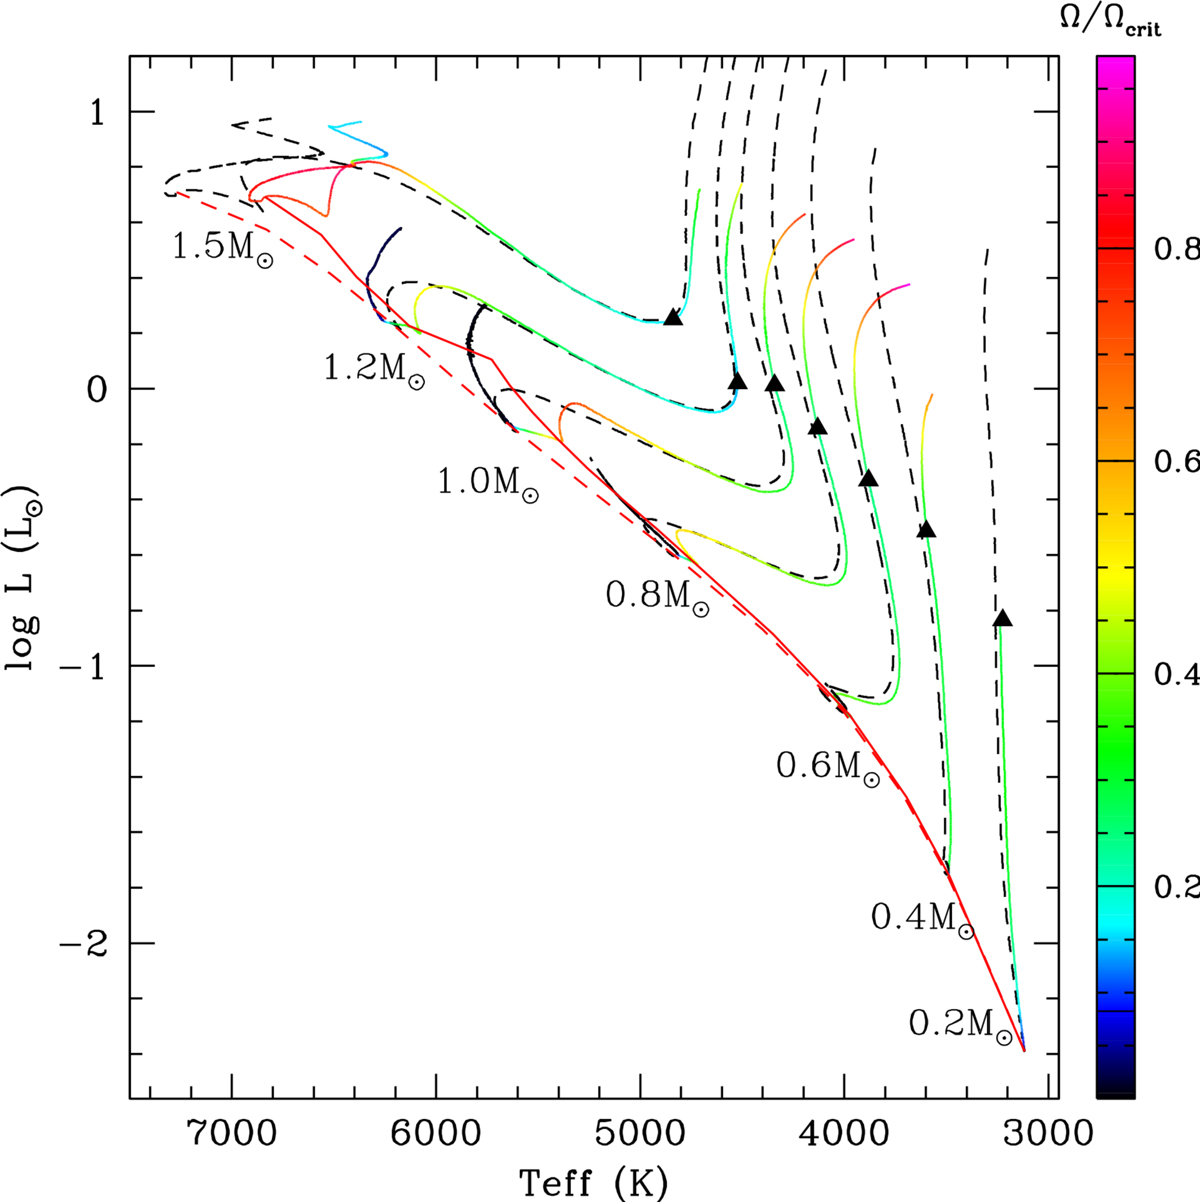
HR diagram of solar metallicity models without (dashed black line) and with rotation (solid coloured lines; here we show the fast rotators). The values of the surface velocity normalised to the break-up value (Ω/Ωcrit) increase from blue to red as shown on the right colour bar. The black triangles indicate when the rotating models are released from their disc. The red lines indicate the standard (dashed) and rotating (solid) ZAMS.
Current usage metrics show cumulative count of Article Views (full-text article views including HTML views, PDF and ePub downloads, according to the available data) and Abstracts Views on Vision4Press platform.
Data correspond to usage on the plateform after 2015. The current usage metrics is available 48-96 hours after online publication and is updated daily on week days.
Initial download of the metrics may take a while.