Free Access
Fig. 2.
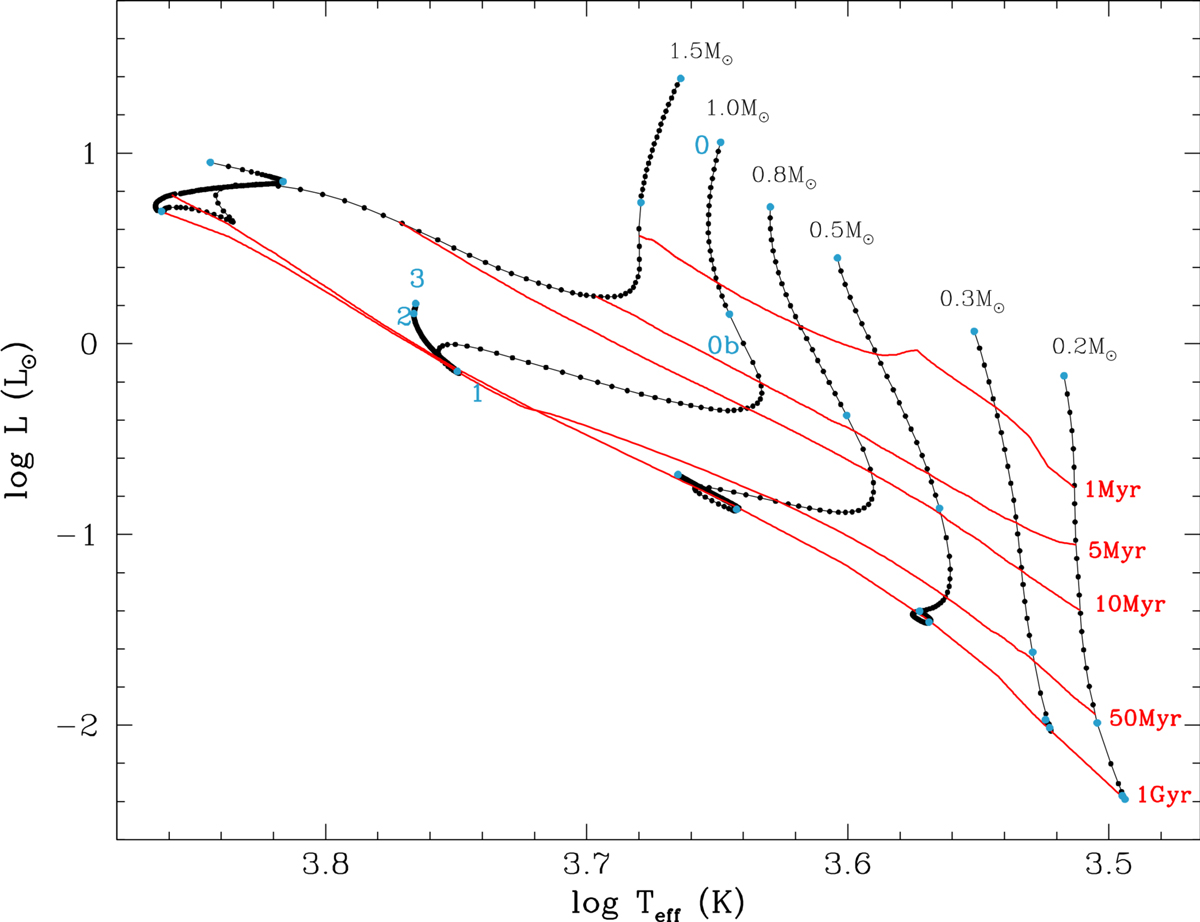
Evolution track in the Hertzsprung–Russell diagram of six standard models of 0.2, 0.3, 0.5, 0.7, 1.0 and 1.5 M⊙ at solar metallicity. Isochrones corresponding to 1, 5, 10, 50 Myr and 1 Gyr are also represented in red. In blue are shown the evolutionary points described in the text.
Current usage metrics show cumulative count of Article Views (full-text article views including HTML views, PDF and ePub downloads, according to the available data) and Abstracts Views on Vision4Press platform.
Data correspond to usage on the plateform after 2015. The current usage metrics is available 48-96 hours after online publication and is updated daily on week days.
Initial download of the metrics may take a while.