Fig. A.1.
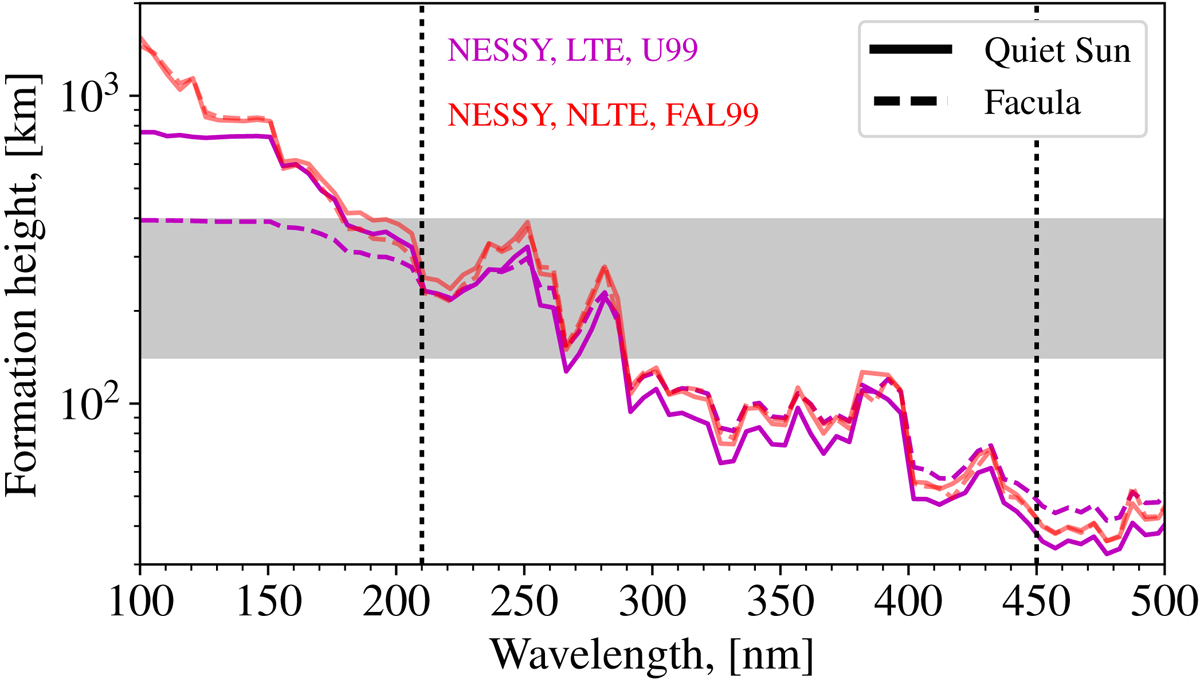
Formation height of full-disc quiet Sun and facular fluxes computed with NESSY for LTE-U99 and NLTE-FAL99 cases. The intermediate case (NLTE-U99) has been omitted for visual clarity. The vertical dotted lines refer to the same spectral domain as in the top panel of Fig. 4. The grey area designates the region, where the temperature differences between quiet Sun and facula in the U99 and FAL99 atmospheric model sets are equal (see Fig. 1, bottom panel). The high resolution formation heights (2000 points per nm) were weighted with the corresponding intensity, averaged over 1 nm intervals and then shifted in the same way as the height grids in Fig. 1.
Current usage metrics show cumulative count of Article Views (full-text article views including HTML views, PDF and ePub downloads, according to the available data) and Abstracts Views on Vision4Press platform.
Data correspond to usage on the plateform after 2015. The current usage metrics is available 48-96 hours after online publication and is updated daily on week days.
Initial download of the metrics may take a while.