Fig. 7.

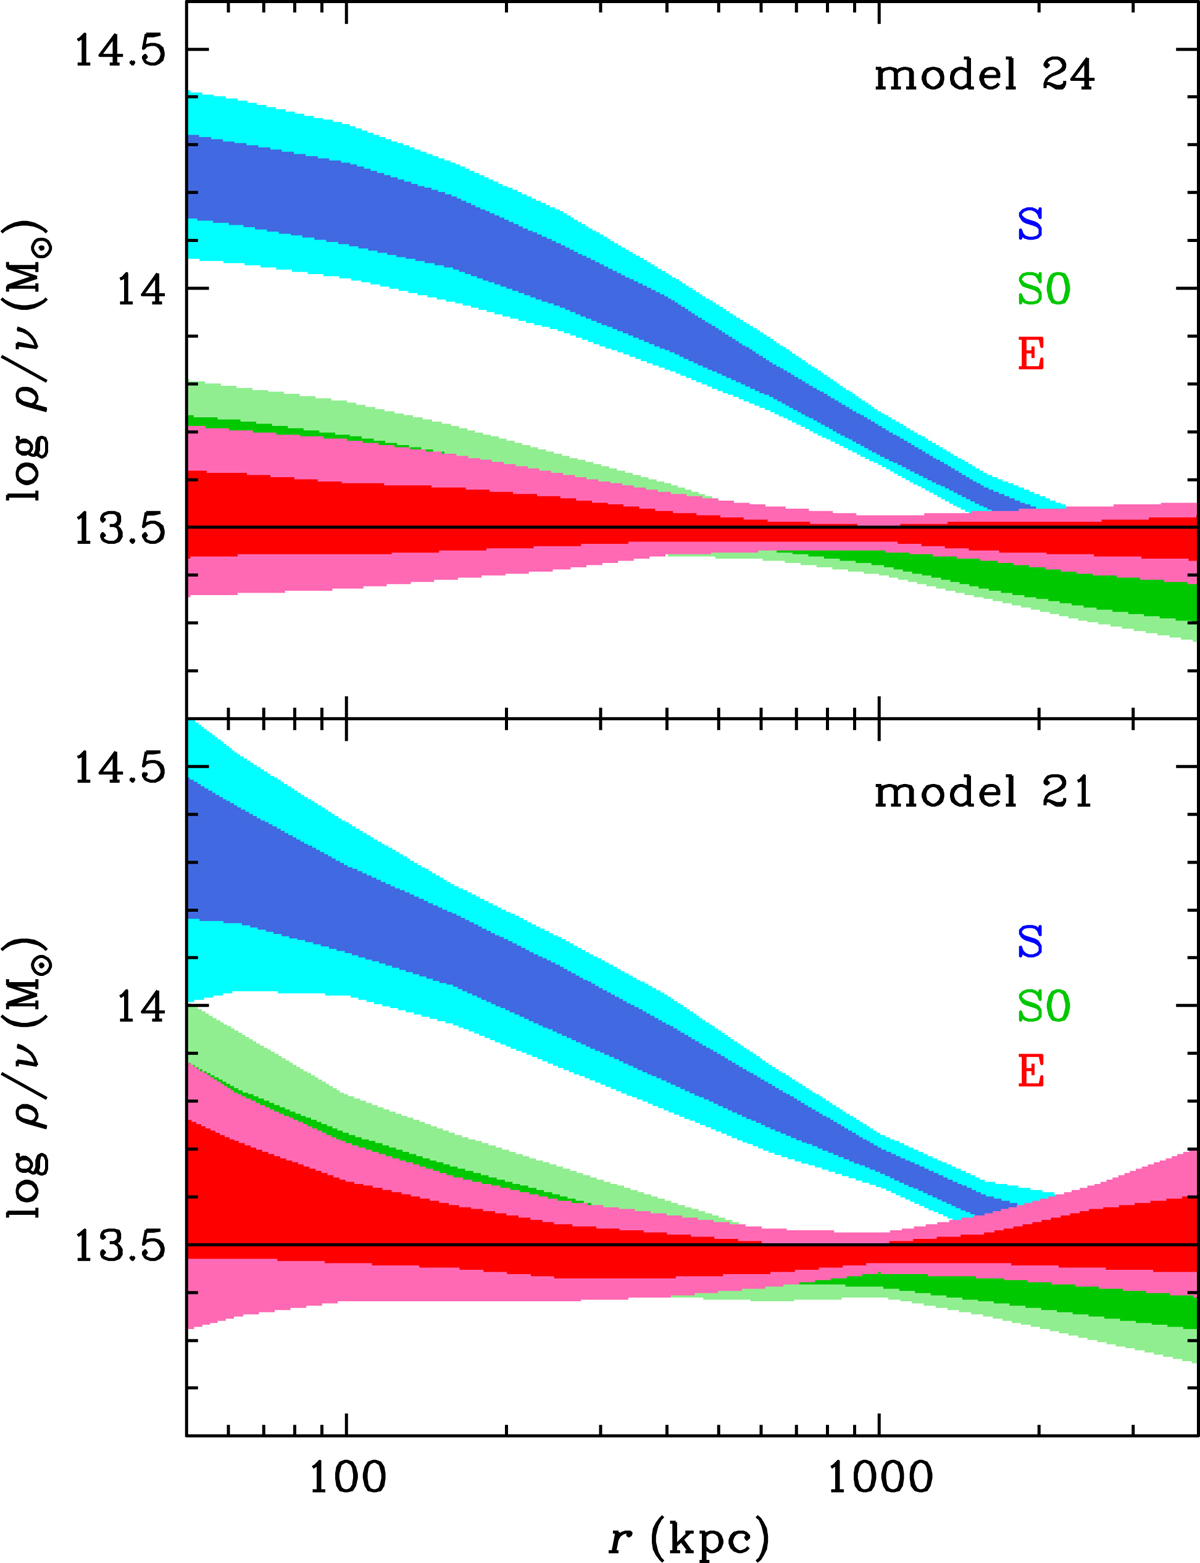
Velocity anisotropy (Eq. (19)) profiles of E, S0, and S galaxies from MAMPOSSt for model 24 (NFW with T-TAND anisotropy for spirals only, upper left), model 9 (NFW with T-TAND anisotropy, upper right), model 1 (gNFW with T-TAND anisotropy, lower left), and model 7 (gNFW with T anisotropy and free anisotropy radius, lower right) for sigv-stacked pseudo-cluster. The hashed regions indicate the 68% confidence zone, while the curves display the 5th and 95th percentiles. The thick vertical gray line indicates the position of r100 = 1.35 r200, which is close to the theoretical virial radius, where its width shows the uncertainty on log r200.
Current usage metrics show cumulative count of Article Views (full-text article views including HTML views, PDF and ePub downloads, according to the available data) and Abstracts Views on Vision4Press platform.
Data correspond to usage on the plateform after 2015. The current usage metrics is available 48-96 hours after online publication and is updated daily on week days.
Initial download of the metrics may take a while.


