Fig. 15.
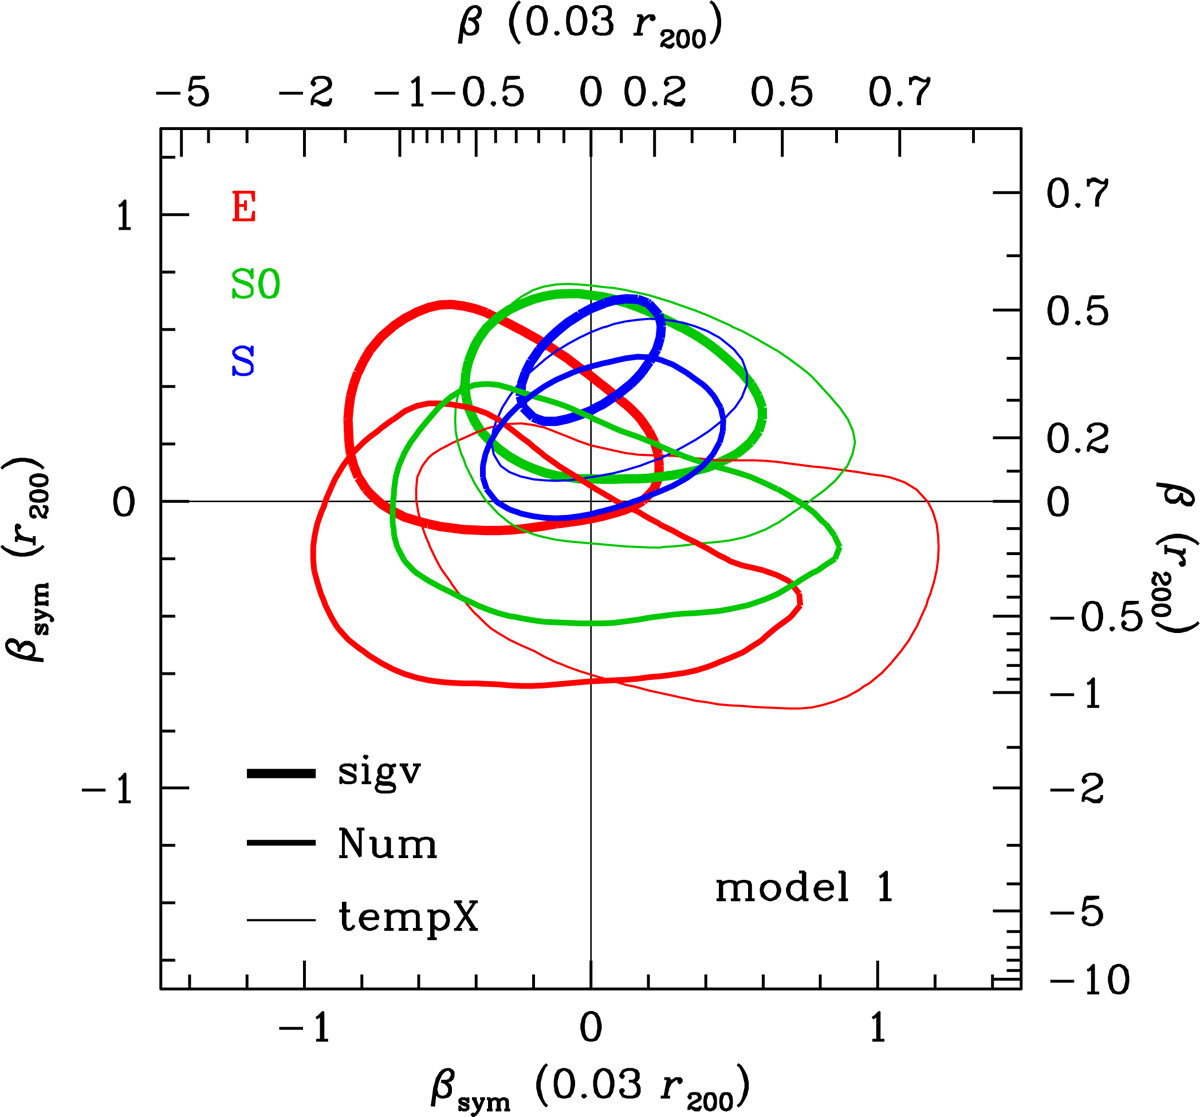
Comparison with previous measurements (shown in symbols) of velocity anisotropy (Eq. (19)) from MAMPOSSt (68% confidence contours) at 0.03 r200 and r200 for models 1 (gNFW, T, TAND, left) and 7 (same as 1 but with free anisotropy radii, right), all for sigv-stacked pseudo-cluster. Top panels: comparison with the full literature over the entire possible range of anisotropies (for Hwang & Lee (2008), only Abell 85 (black) and Abell 2199 (red and blue) are shown). Bottom panels: zooms, restricted to previous works that differentiated between galaxy types (with the same symbol meanings as in the top panel). The open and filled symbols respectively correspond to single clusters and stacks of clusters. The symbols are color-coded by the galaxy population: red for early-type or passive, blue for late-type or star forming, and black for all galaxies (mixed types). In the legend (top panels), the purple symbols denote studies that separately analyzed both passive (or red) and star forming (or blue) galaxies. The vertical and horizontal lines respectively indicate isotropic inner and outer velocities. The two symbols for Biviano & Katgert are for the Sa and Sb spirals (β(0.03 r200) = 0.2) and for the later type spirals (β(0.03r200)= − 1.7). The two for Annunziatella et al. refer to low (β(0.03 r200)≈ − 0.6) and high (β(0.03r200)≈0.1) mass galaxies. Finally, the two blue symbols for Aguerri et al. are for all (β(r200)≈0.5) and dwarf (β(r200)≈0) galaxies.
Current usage metrics show cumulative count of Article Views (full-text article views including HTML views, PDF and ePub downloads, according to the available data) and Abstracts Views on Vision4Press platform.
Data correspond to usage on the plateform after 2015. The current usage metrics is available 48-96 hours after online publication and is updated daily on week days.
Initial download of the metrics may take a while.