Fig. 1.
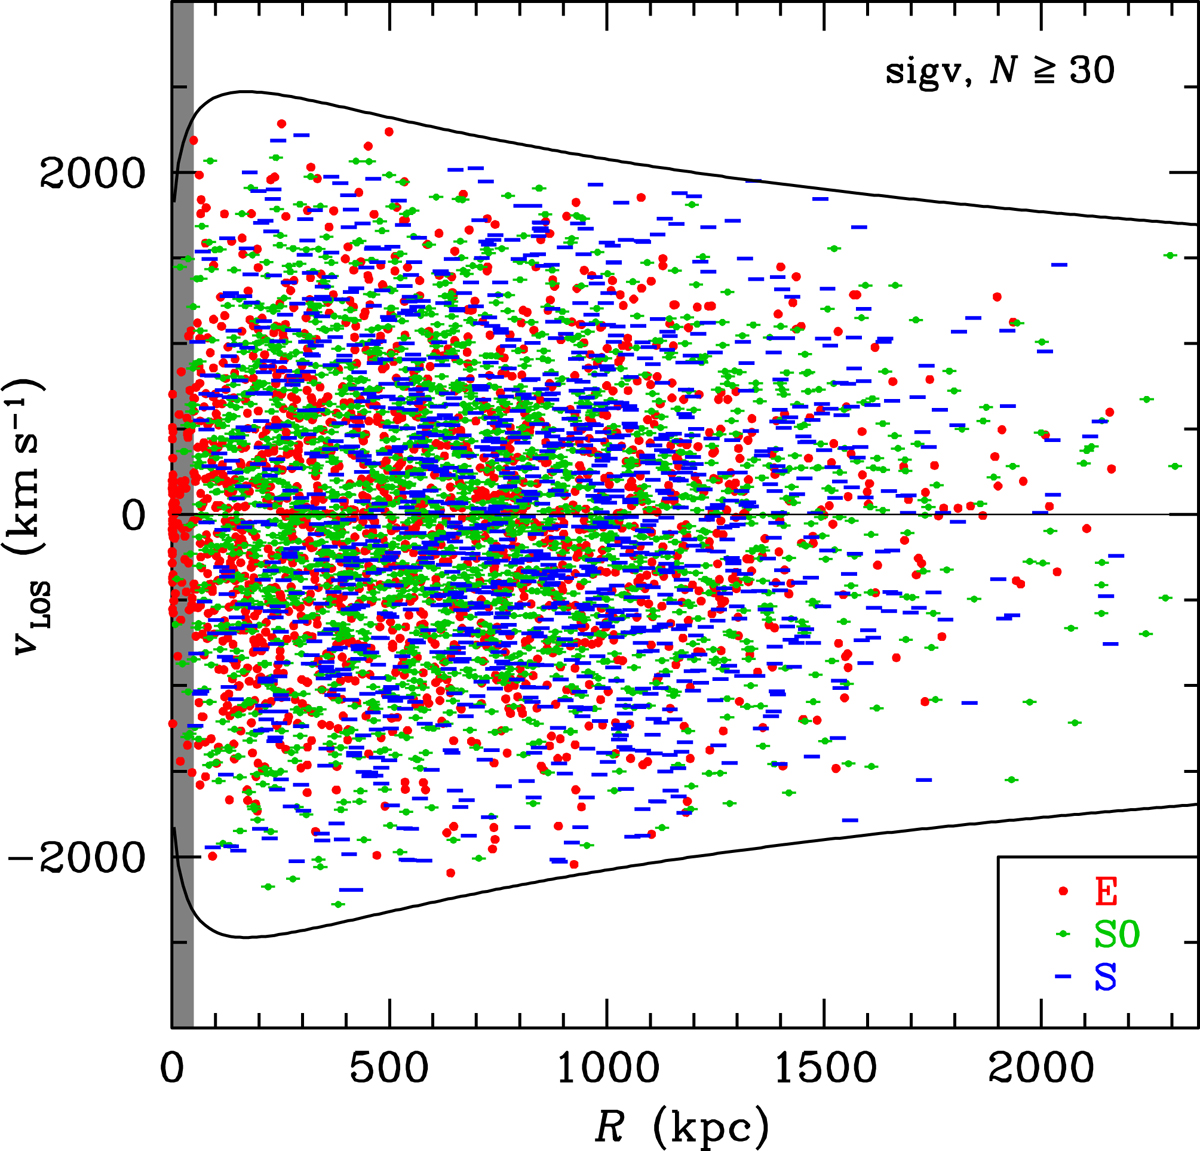
Projected phase space diagram of sigv-stacked pseudo-cluster. Each symbol is a galaxy, with shapes and colors provided in the legend. The maximum projected radius corresponds to our maximum allowed value of 1.35 r200 ≃ r100. The typical velocity errors are 53 km s−1. The gray shaded region denotes the inner projected radii that are not considered in the MAMPOSSt analysis. The curves indicate the ±2.7σLOS(R) conditions obtained from the Clean algorithm (Sect. 3.1).
Current usage metrics show cumulative count of Article Views (full-text article views including HTML views, PDF and ePub downloads, according to the available data) and Abstracts Views on Vision4Press platform.
Data correspond to usage on the plateform after 2015. The current usage metrics is available 48-96 hours after online publication and is updated daily on week days.
Initial download of the metrics may take a while.