Fig. A.3.
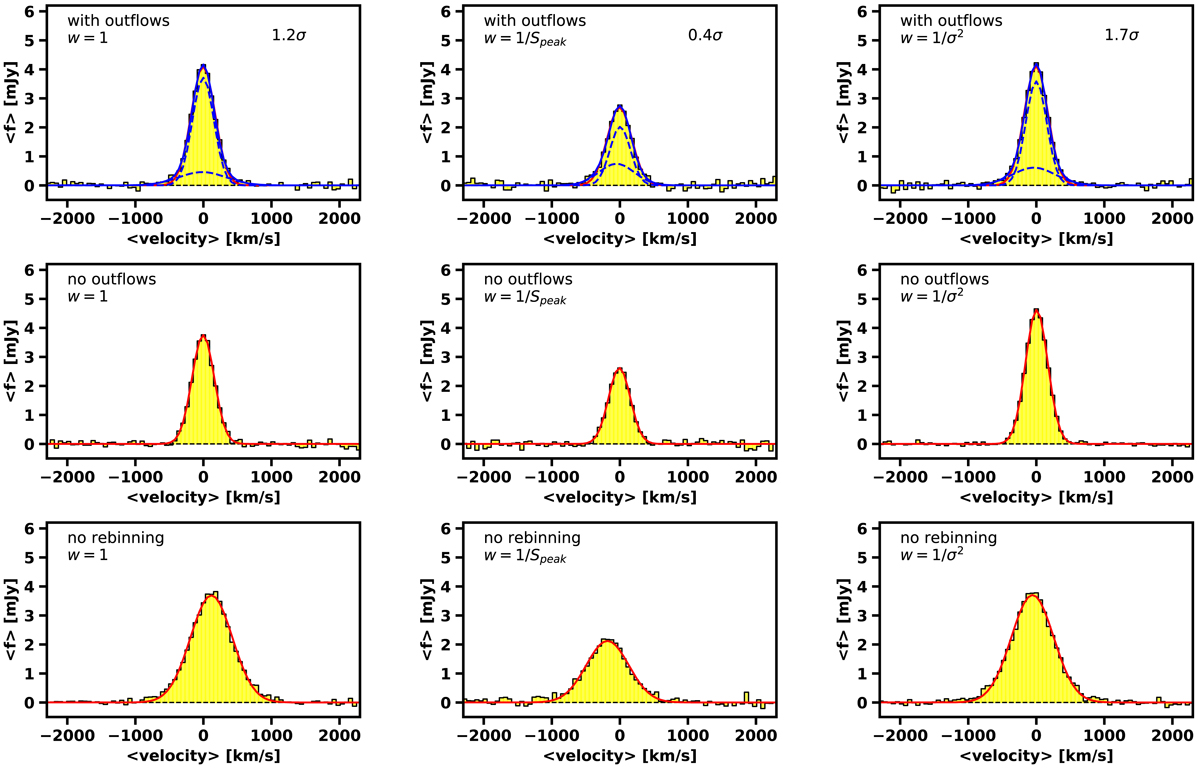
Top: example spectra from the test on stacking mock samples where all sources had a broad component below the noise levels, for each of the different weights usedd. Also given are the significance values of the excess emission due to a broad component, for each example. Middle: example spectra from the test on stacking mock samples where all sources had no added broad component. Bottom: example spectra from the test on stacking mock samples where all sources had no added broad component, but without using velocity re-binning. We also show the one (red curve) and two-component fits (blue solid and dashed curves) to the stacked lines.
Current usage metrics show cumulative count of Article Views (full-text article views including HTML views, PDF and ePub downloads, according to the available data) and Abstracts Views on Vision4Press platform.
Data correspond to usage on the plateform after 2015. The current usage metrics is available 48-96 hours after online publication and is updated daily on week days.
Initial download of the metrics may take a while.