Fig. 5.
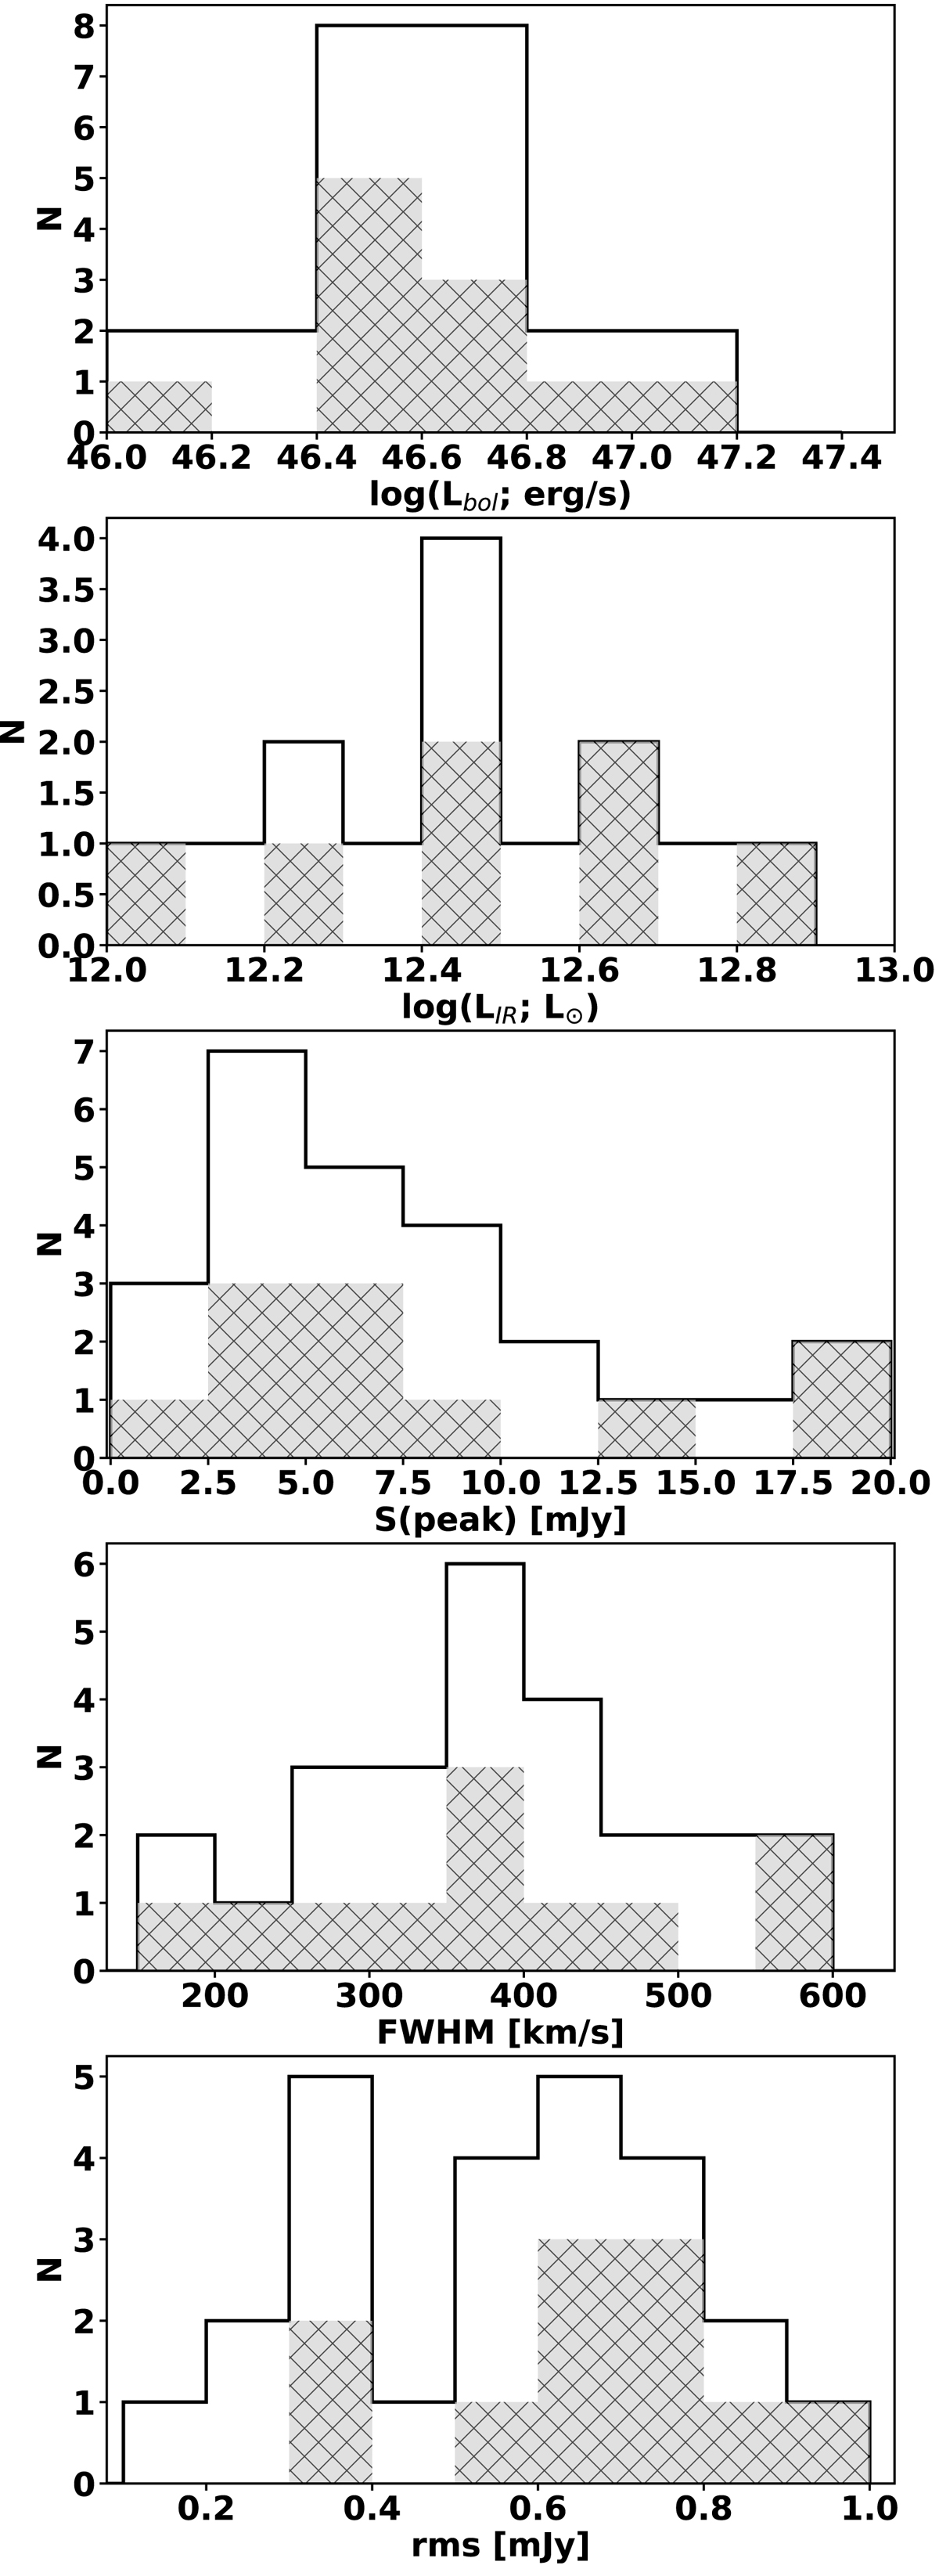
Distribution of the properties of the max sub-sample sources (filled in regions) in comparison to the full sample of this study (main histogram). From top to bottom we compare: the bolometric luminosity of the quasars (Lbol), the IR (8–1000 μm) luminosity of the galaxies (LIR), the Speak, the FWHM, and the rms of the of the individual [C II] lines (before the velocity rebinning). It is evident that the max sub-sample covers a wide range of values in all properties, and is not skewed towards the brightest quasars, specific line-widths or line strength. The max sub-sample does seem to prefer higher rms values, but this is restricted by small number statistics.
Current usage metrics show cumulative count of Article Views (full-text article views including HTML views, PDF and ePub downloads, according to the available data) and Abstracts Views on Vision4Press platform.
Data correspond to usage on the plateform after 2015. The current usage metrics is available 48-96 hours after online publication and is updated daily on week days.
Initial download of the metrics may take a while.