Fig. 4.
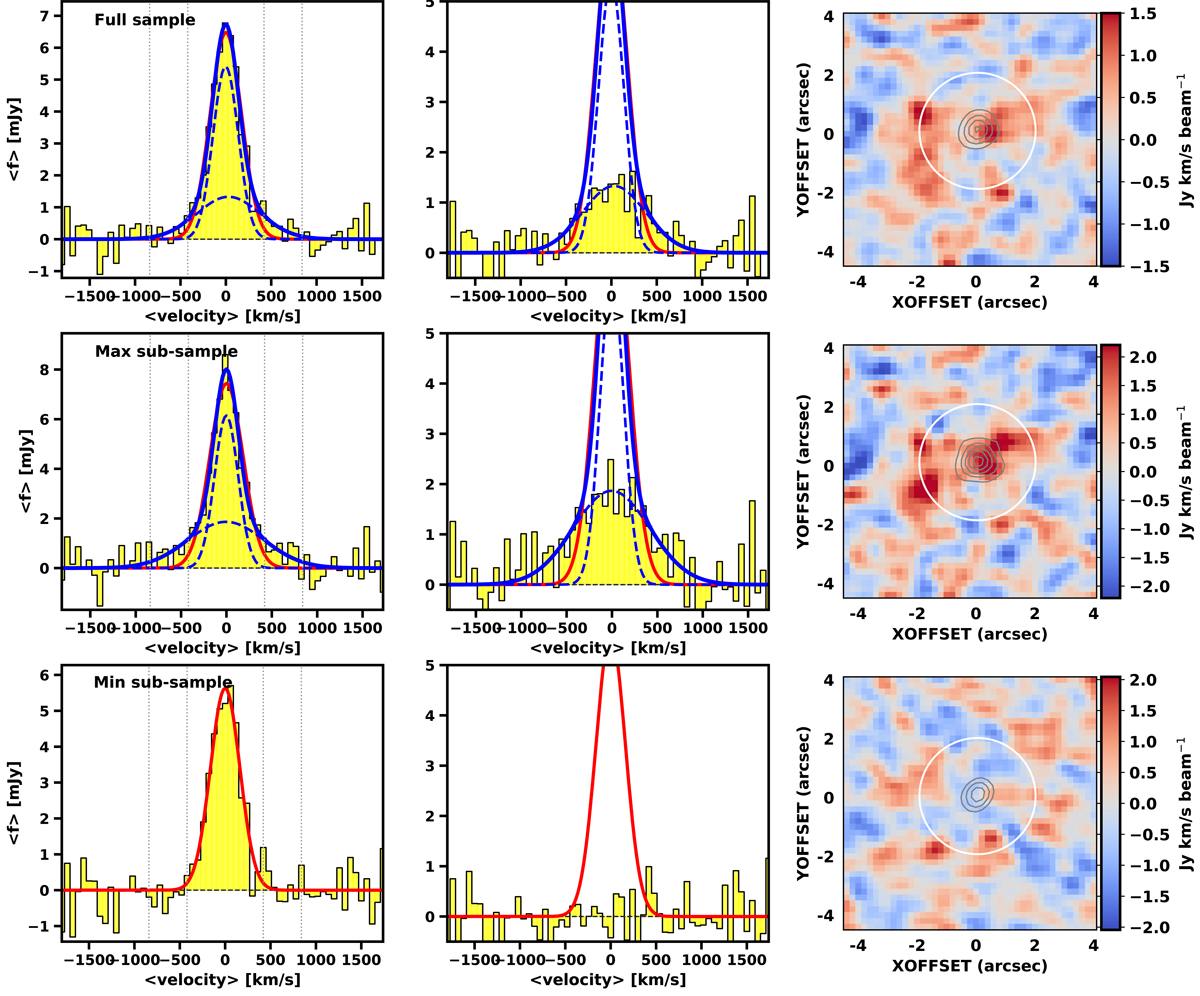
Results from our 3D stacking analysis, for w = 1. From left to right: [C II] line extracted from the stacked cube within a 2″ radius from the centre, a zoom-in view of the broad line component once the narrow component has been removed, combined image of the [C II] line wings from ±420–840 km s−1 (see vertical dotted lines in the spectrum), for the full sample (1st row), the max sub-sample (2nd row), and min sub-sample (3rd row). We also show the one (red curve) and two-component fits (blue solid and dashed curves) to the stacked line. The extent of the narrow component emission is shown with the black contours in the combined images, and the white circle corresponds to the area within a 2″ radius from the centre.
Current usage metrics show cumulative count of Article Views (full-text article views including HTML views, PDF and ePub downloads, according to the available data) and Abstracts Views on Vision4Press platform.
Data correspond to usage on the plateform after 2015. The current usage metrics is available 48-96 hours after online publication and is updated daily on week days.
Initial download of the metrics may take a while.