Fig. 2.
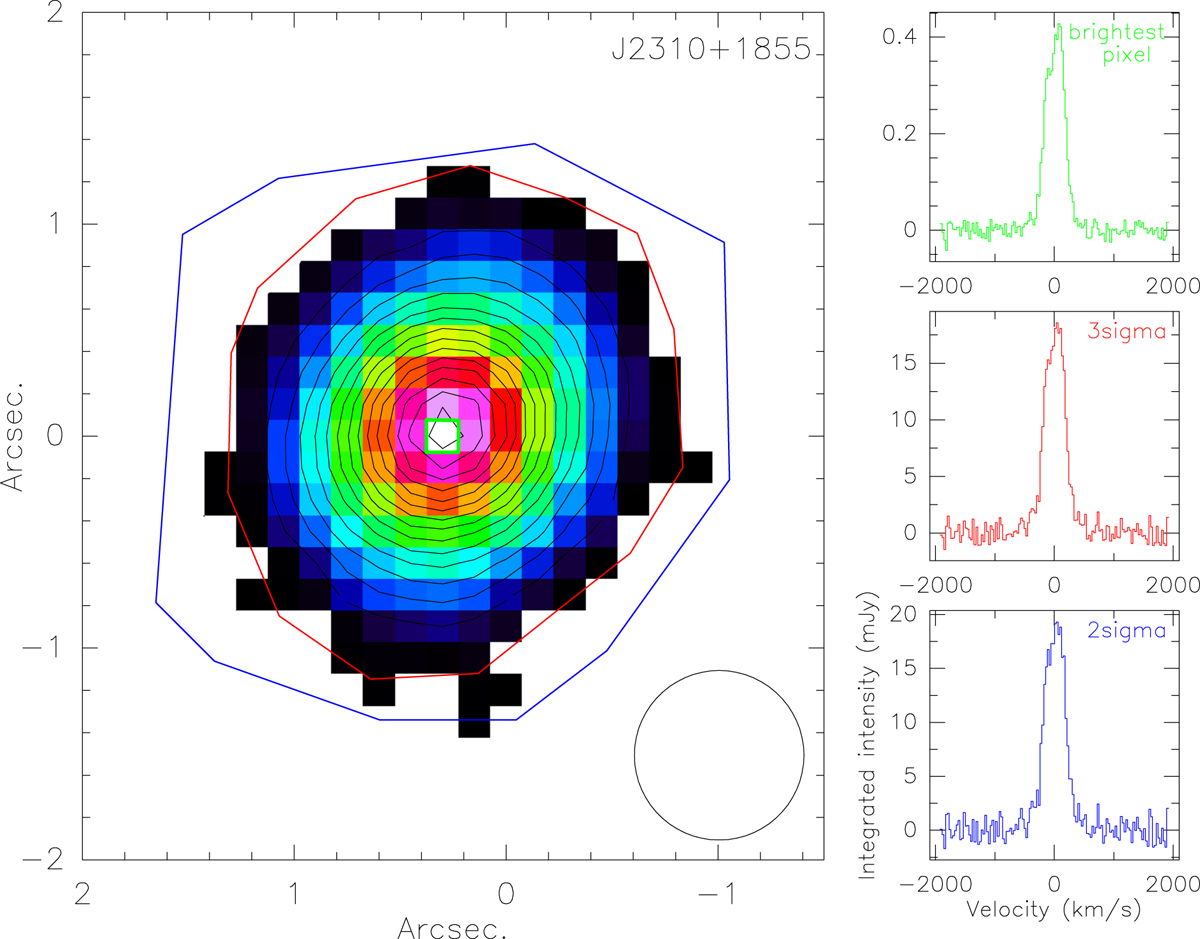
Example for an integrated intensity distribution (moment zero map) and spectra extracted from different regions in J2310+1855. The green box marks the area of the brightest pixel, the area marked by the red line contains all signal above the 3σ threshold, and the blue line outlines the region with signals above 2σ. The spectra extracted from these three regions are shown on the right-hand side. They are colour-coded according to the region from which they were extracted, and the region of extraction is mentioned in the panel for each spectrum as well. On the lower-left side of the image we also show the beam size of our images.
Current usage metrics show cumulative count of Article Views (full-text article views including HTML views, PDF and ePub downloads, according to the available data) and Abstracts Views on Vision4Press platform.
Data correspond to usage on the plateform after 2015. The current usage metrics is available 48-96 hours after online publication and is updated daily on week days.
Initial download of the metrics may take a while.