Fig. 19.
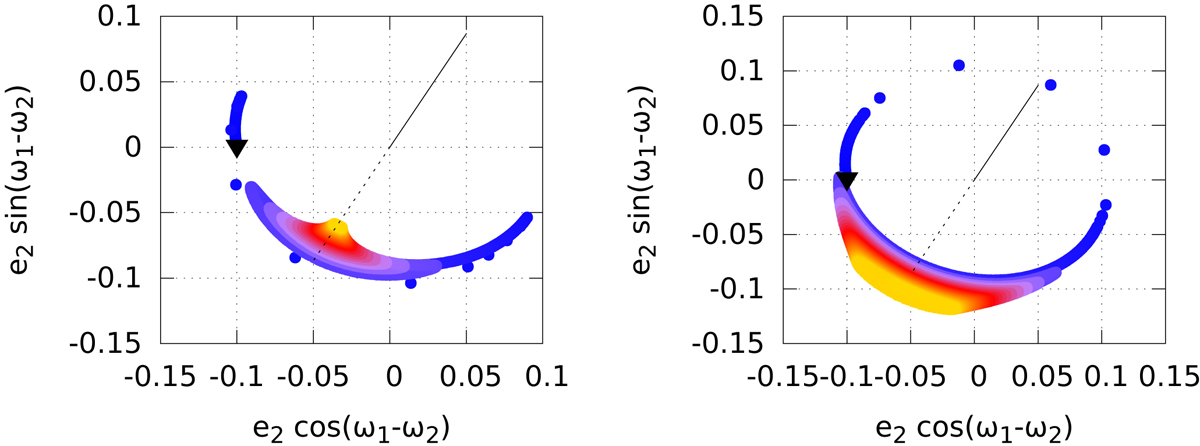
Examples of the evolution of the quantities e2 and Δϖ for different initial conditions. The black dashed lines represent the direction of the anti-Lagrangian configuration while the black solid line is the direction of the Eccentric Lagragian equilibria. In both cases, the initial conditions are ω2 = ω1 + π, I1 = I2 = 0, m1 = 10m2 = 1 × 10⁻⁴m0, a1 = a2 = 1 au, e1 = 0.1, e2 = m1e1/m2 and ζ = 60°. Each trajectory is integrated for 20 Kyr, with the initial conditions represented by the black triangle, and the colour code representing the time (blue at t = 0, yellow at 20 Kyr). On the left panel, τe2/τa1 = 5, while on the rightτe2/τa1 = 20. In both cases, τa1/τa2 = 0.01.
Current usage metrics show cumulative count of Article Views (full-text article views including HTML views, PDF and ePub downloads, according to the available data) and Abstracts Views on Vision4Press platform.
Data correspond to usage on the plateform after 2015. The current usage metrics is available 48-96 hours after online publication and is updated daily on week days.
Initial download of the metrics may take a while.