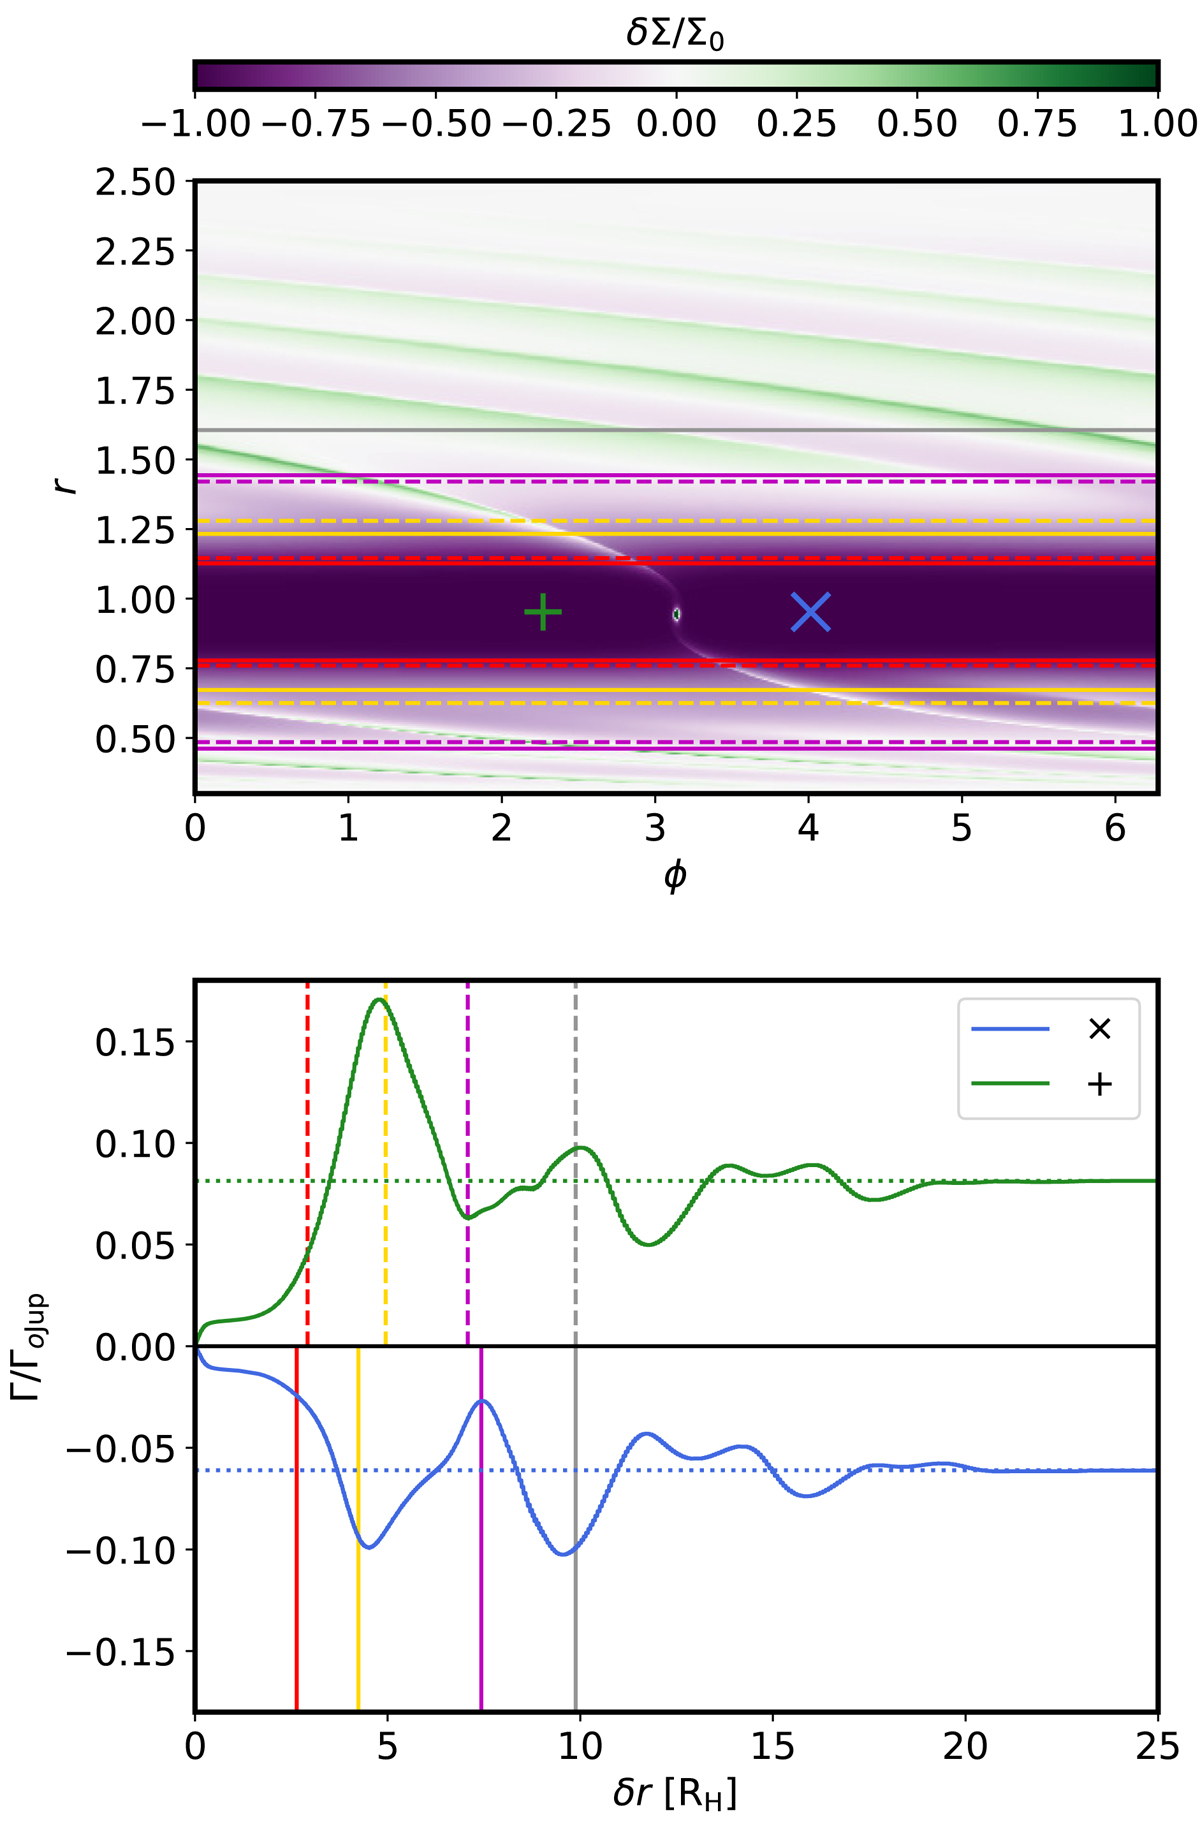
Fig. 15.

Upper panel: perturbed surface density for the models with a Jupiter and an Earth. The location of the low-mass planets are marked with + and × signs. Because the surface density perturbation is identical in both cases, we only show the surface density map of one of them but marked the location of both planets for comparison. The red, yellow, magenta, and grey lines mark different distances from the planets’ orbit. The dashed lines belong to the model with the low-mass planet at × and the solid lines are for the one with planet at +. These lines are also added to the lower panel to denote the effect of the Jupiter’s spirals. Lower panel: same as panel a of Fig. 13. The green and blue curves show the torque on the low-mass planet initiated close to L4 and L5 equilibria, respectively. The scaling is the Jupiter’s Hill radius RH for the x-axis and Γ0 for the y-axis that is calculated using the Jupiter’s mass.
Current usage metrics show cumulative count of Article Views (full-text article views including HTML views, PDF and ePub downloads, according to the available data) and Abstracts Views on Vision4Press platform.
Data correspond to usage on the plateform after 2015. The current usage metrics is available 48-96 hours after online publication and is updated daily on week days.
Initial download of the metrics may take a while.


