Fig. 13.
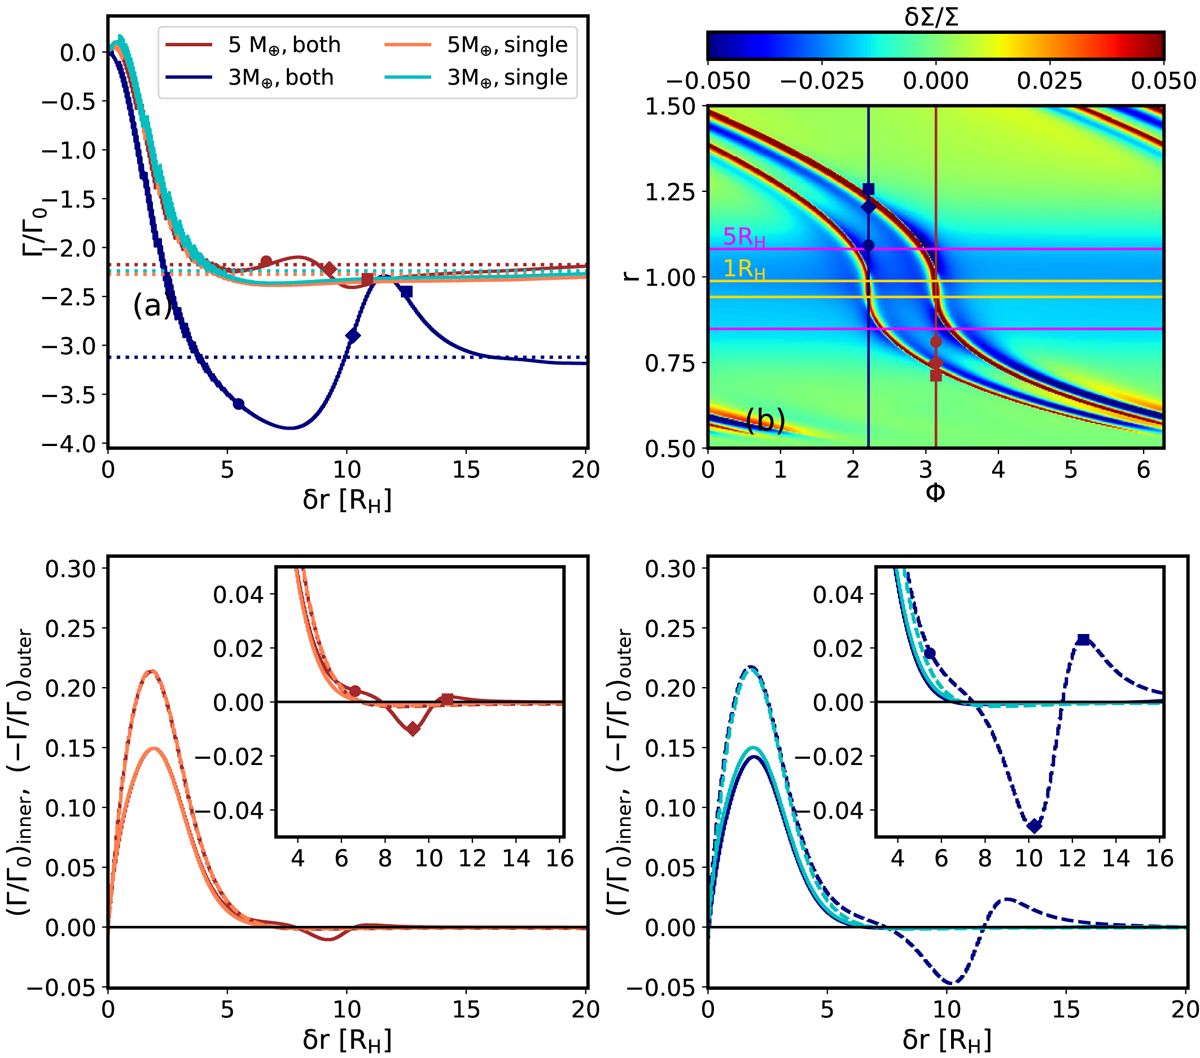
Panel a: comparing the torque from the disc between a − δr and a + δr (solid lines) on m1 = 5 M⊕ planet (red lines) and m2 = 3 M⊕ (blue lines). The lighter colours represent the torques from the simulations with a single planet and the darker ones for the co-orbital simulation. The same colour dotted lines mark the torque from the whole disc. The y-axis is the scaled torque and x-axis the distance from the planets’ orbit in unit of their mutual Hill radius RH. Panel b: perturbed surface density. Two horizontal lines are drawn at 1 and 5RH from the planets’ orbits to guide the eye. Panel c: torque on m2 as a function of distance from the planet. Panel a is the cumulative torque but this panel and panel d show the torque only from the grid cells at a given distance from the planet. The dashed and solid lines belongs to the outer and inner disc, respectively. The colour code is the same as in panel a. To ease the comparison, we plot the negative of the torque from the outer disc. The symbols mark where the torque on the planets change due to the presence of the second planet. Panel d: same as panel c but for m1.
Current usage metrics show cumulative count of Article Views (full-text article views including HTML views, PDF and ePub downloads, according to the available data) and Abstracts Views on Vision4Press platform.
Data correspond to usage on the plateform after 2015. The current usage metrics is available 48-96 hours after online publication and is updated daily on week days.
Initial download of the metrics may take a while.