Fig. 9.
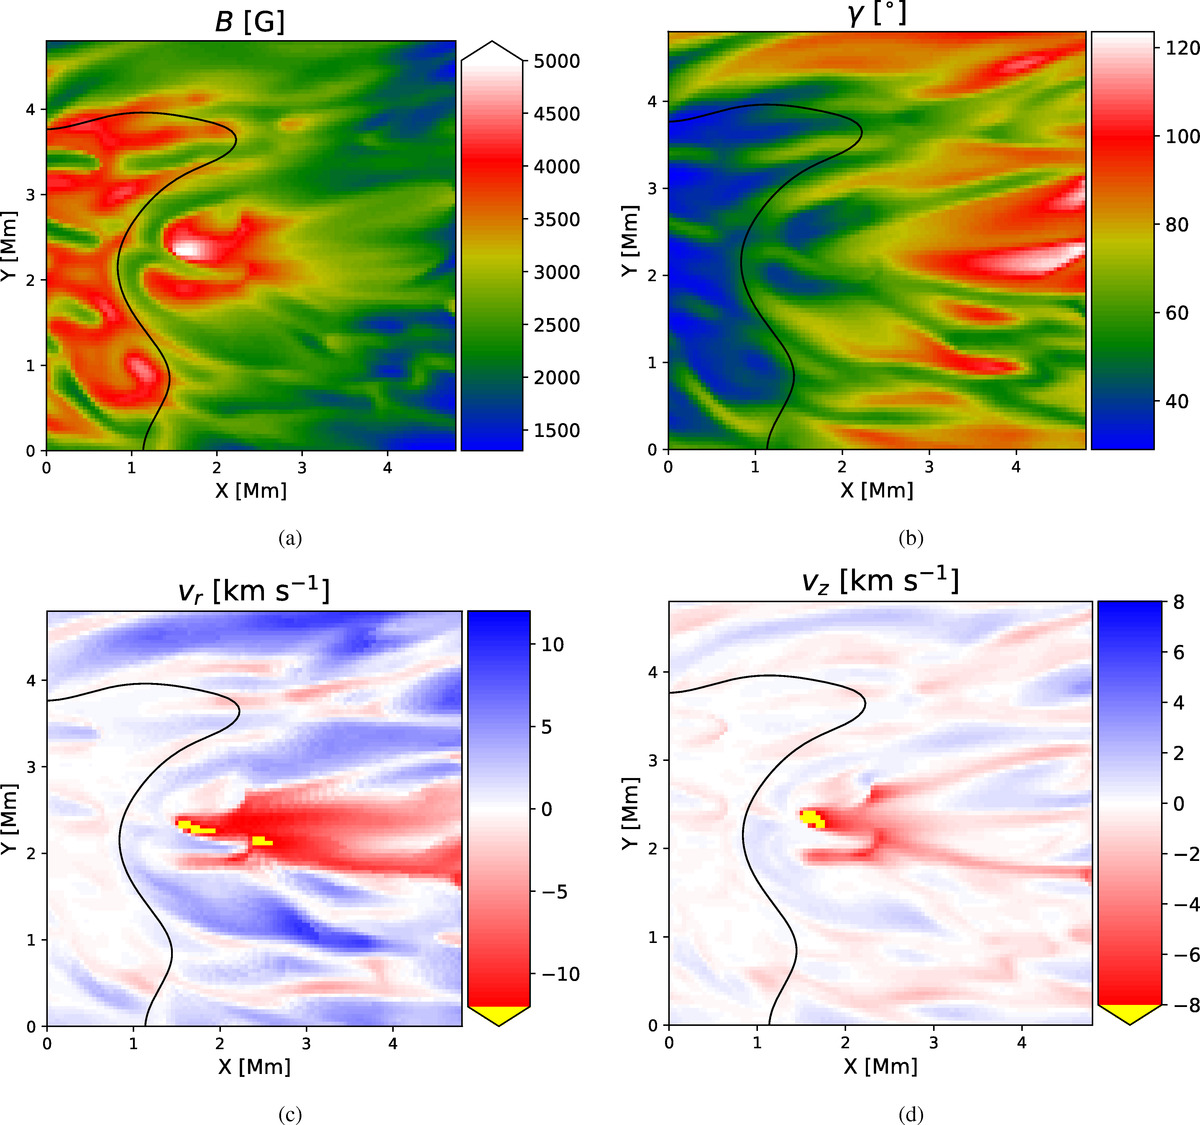
Portion of the inner penumbra in the MURaM sunspot simulation by Rempel (2015) with some filaments hosting a counter-EF (see also Siu-Tapia et al. 2018). The maps show: panel a: magnetic field strength B [G]; panel b: field inclination with respect to the vertical γ [°], i.e., γ = 0° represents a vertical field of umbral polarity, γ = 90° a horizontal field, and γ = 180° a vertical field of opposite polarity to the umbra; panel c: radial flow velocity vr [km s−1]; and panel d: vertical flow velocity vz [km s−1]. Negative vr and vz values (red-to-yellow colors) indicate inflows and downflows, respectively. This sign convention differs from the one used in observational studies, where negative values denote flows moving towards the observer along the LOS. The black contour lines were placed at Ic/IQS < 0.45 near the umbra(left)-penumbra(right) boundary. All maps show the corresponding physical parameters at log(τ) = 0.
Current usage metrics show cumulative count of Article Views (full-text article views including HTML views, PDF and ePub downloads, according to the available data) and Abstracts Views on Vision4Press platform.
Data correspond to usage on the plateform after 2015. The current usage metrics is available 48-96 hours after online publication and is updated daily on week days.
Initial download of the metrics may take a while.