Fig. 5.
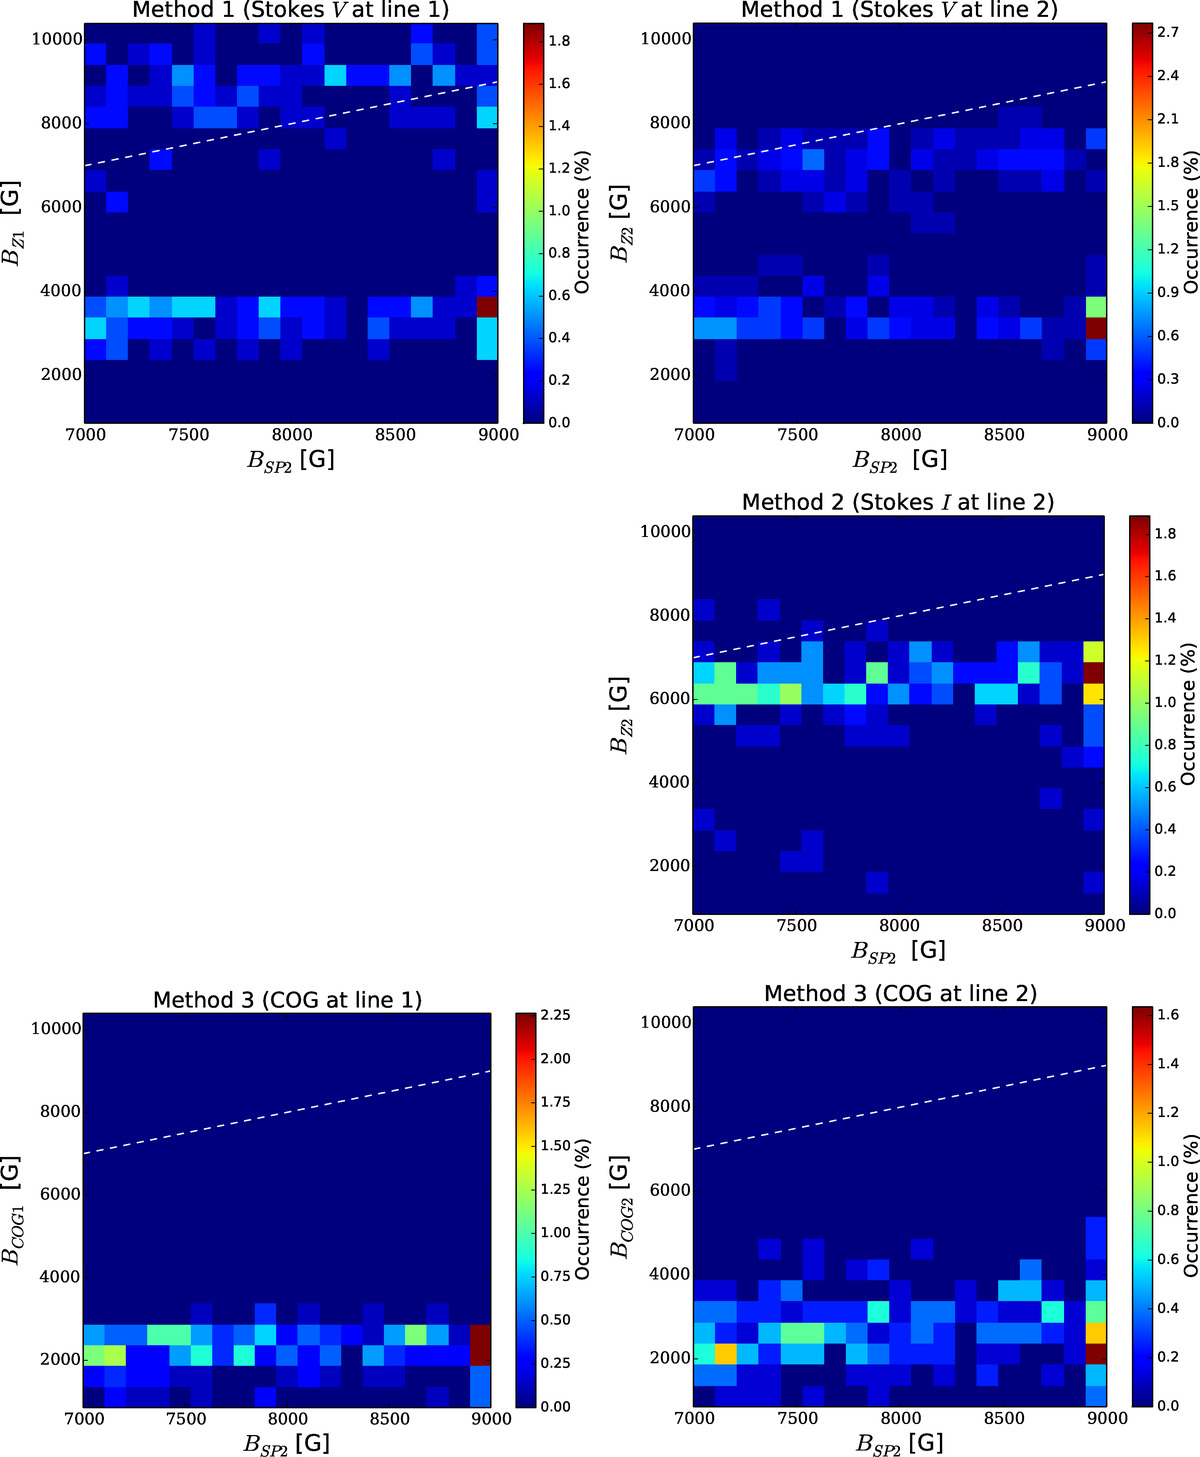
Scatter plots of the 226 LFPs where SPINOR 2D returns B > 7 kG at log(τ) = 0 (BSP2). The y axis indicates magnetic field values obtained with each of the three alternative methods (direct Zeeman splitting and COG methods, BZ and BCOG respectively) as described in the text and displayed in Table 1. From top to bottom: Methods 1, 2, and 3 for line 1 at λ = 6301.5 Å (subscript 1, left plots) and for line 2 at λ = 6302.5 Å (subscript 2, right plots). Dashed lines represent expectation values if both methods give identical results (white).
Current usage metrics show cumulative count of Article Views (full-text article views including HTML views, PDF and ePub downloads, according to the available data) and Abstracts Views on Vision4Press platform.
Data correspond to usage on the plateform after 2015. The current usage metrics is available 48-96 hours after online publication and is updated daily on week days.
Initial download of the metrics may take a while.