Fig. 4
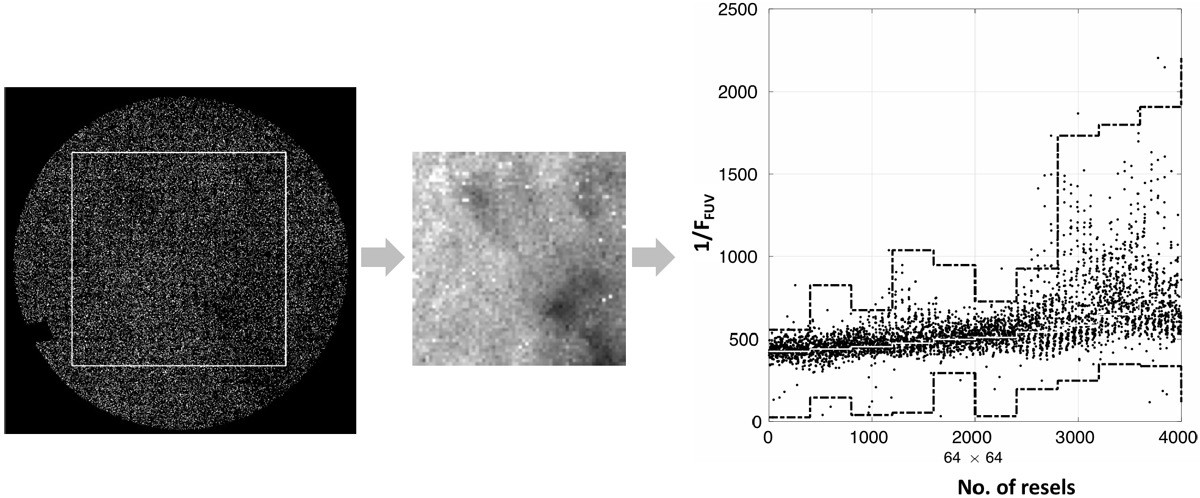
Procedure to compute the BSVR. A sample GALEX image is displayed in the leftmost panel, as well as the central square used to compute the BSVR. This central square rebined into an image of 64 × 64 resels which is displayed in the central panel. From the inverse of this image, a vector, V, is constructed by re-arranging its elements (see text); they are plot in the right panel. The envelopes in this panel are constructed as follows: every 400 elements, the mean (white line), the maximum, and the minimum (bold dashed lines) are computed. The BSVR is determined from these values (see text for further details).
Current usage metrics show cumulative count of Article Views (full-text article views including HTML views, PDF and ePub downloads, according to the available data) and Abstracts Views on Vision4Press platform.
Data correspond to usage on the plateform after 2015. The current usage metrics is available 48-96 hours after online publication and is updated daily on week days.
Initial download of the metrics may take a while.