Free Access
Fig. 10
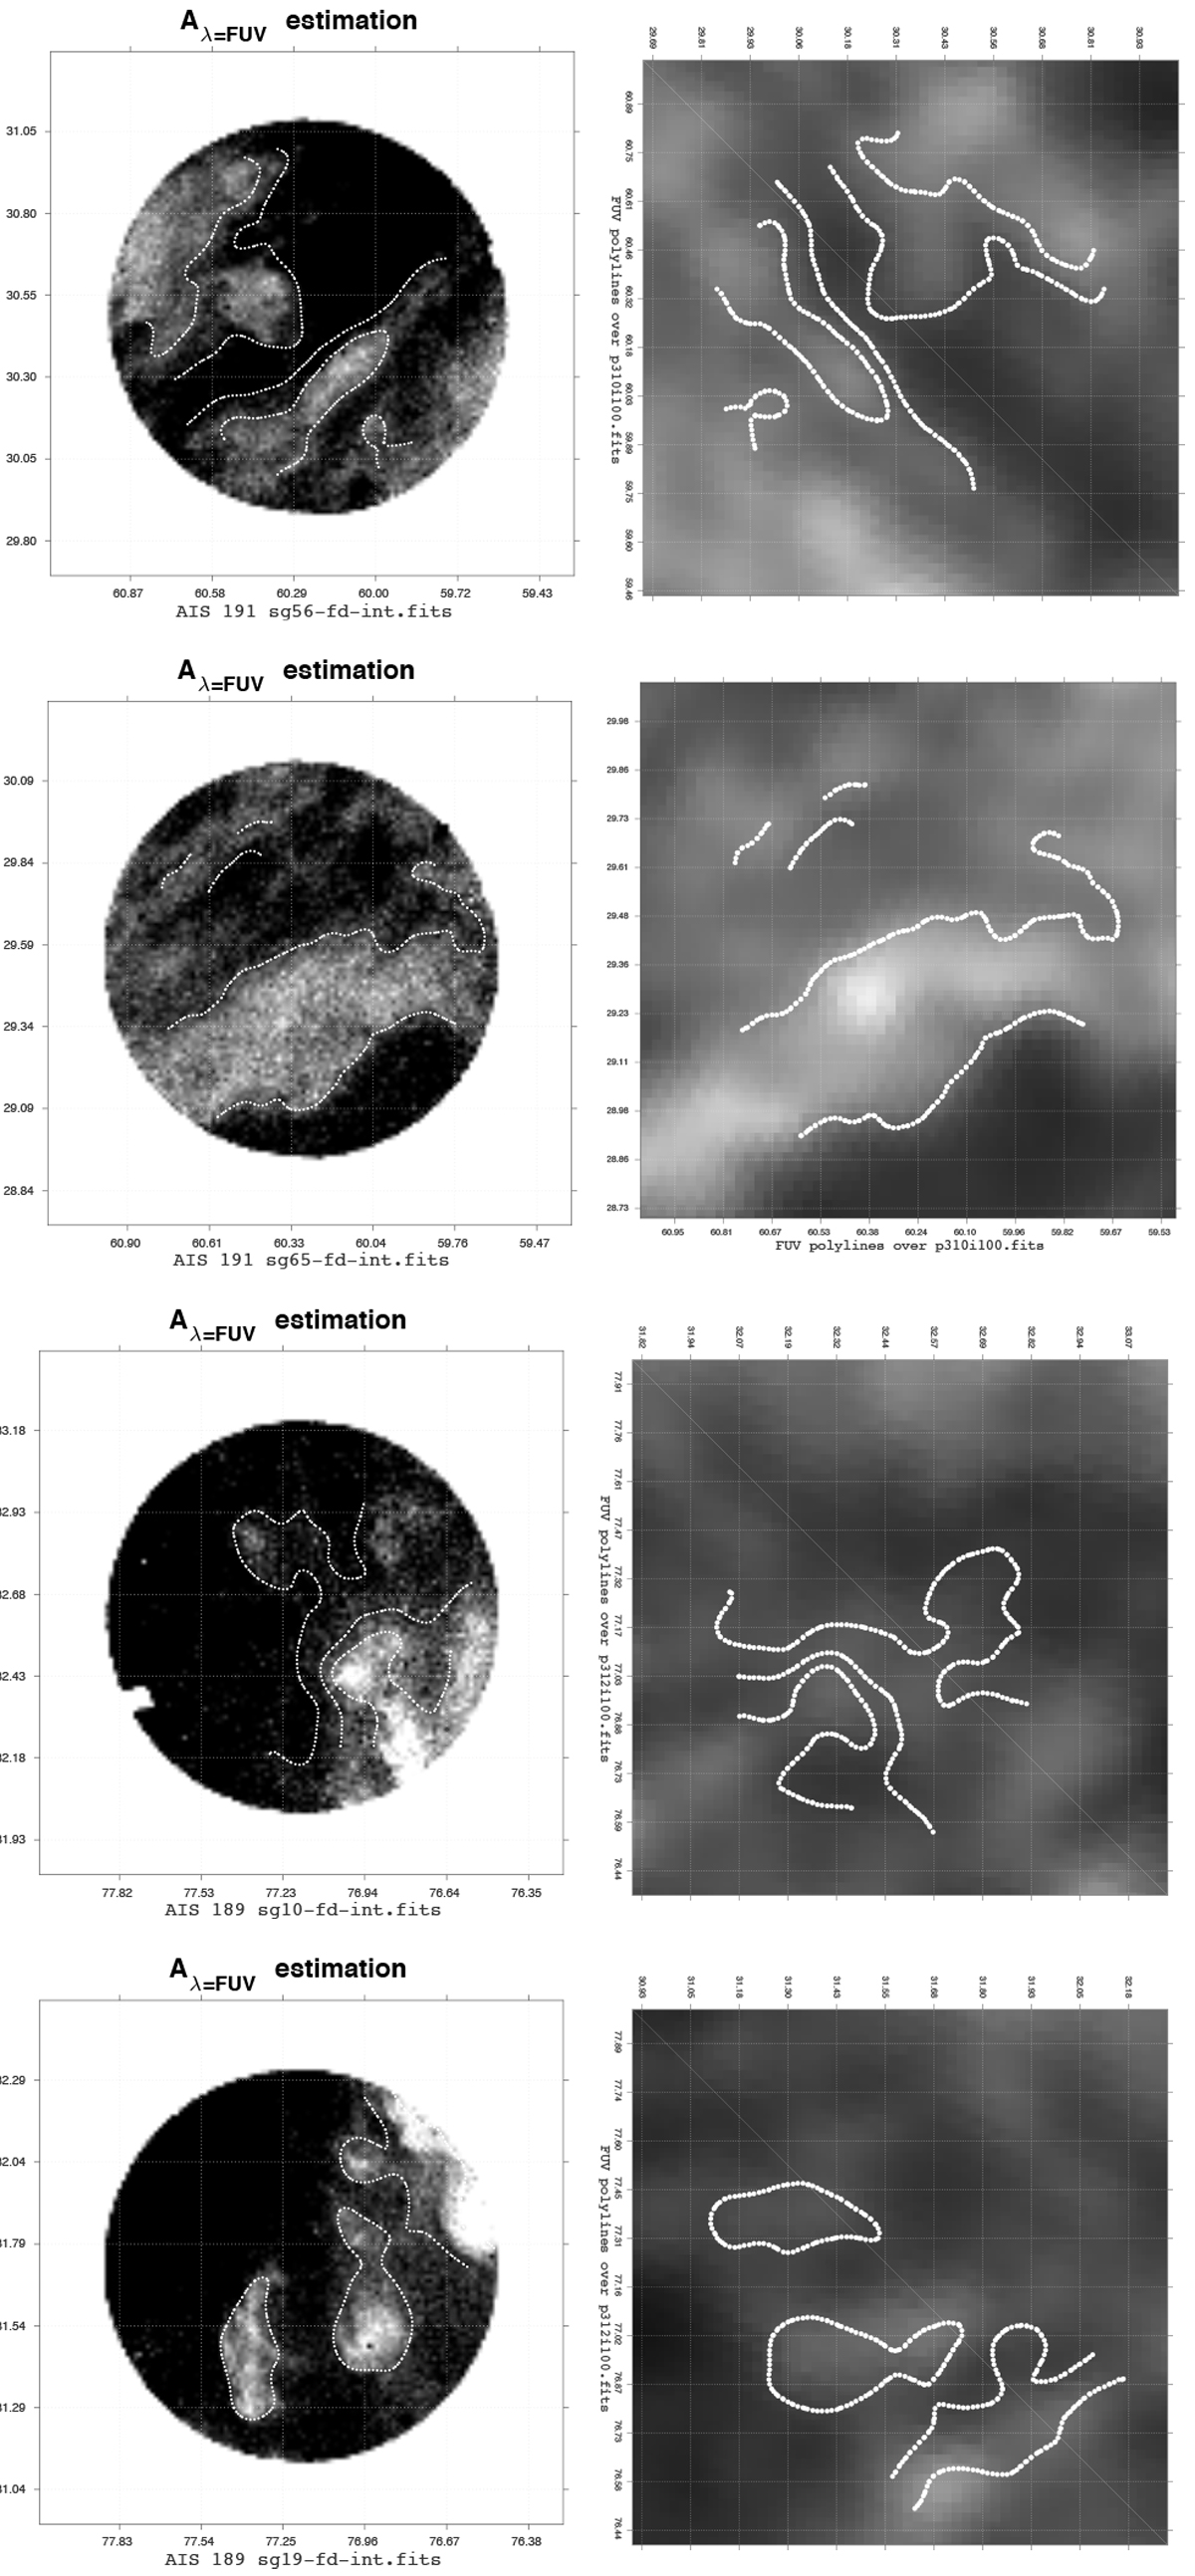
Left: relative extinction maps for some areas of the Taurus-Auriga star forming complex. Right: same areas in the IRAS 100 microns maps. The main features extracted from the UV relative extinction maps are marked in both plots to test the overlap with IRAS; in these examples the match is significant.
Current usage metrics show cumulative count of Article Views (full-text article views including HTML views, PDF and ePub downloads, according to the available data) and Abstracts Views on Vision4Press platform.
Data correspond to usage on the plateform after 2015. The current usage metrics is available 48-96 hours after online publication and is updated daily on week days.
Initial download of the metrics may take a while.