Fig. 1
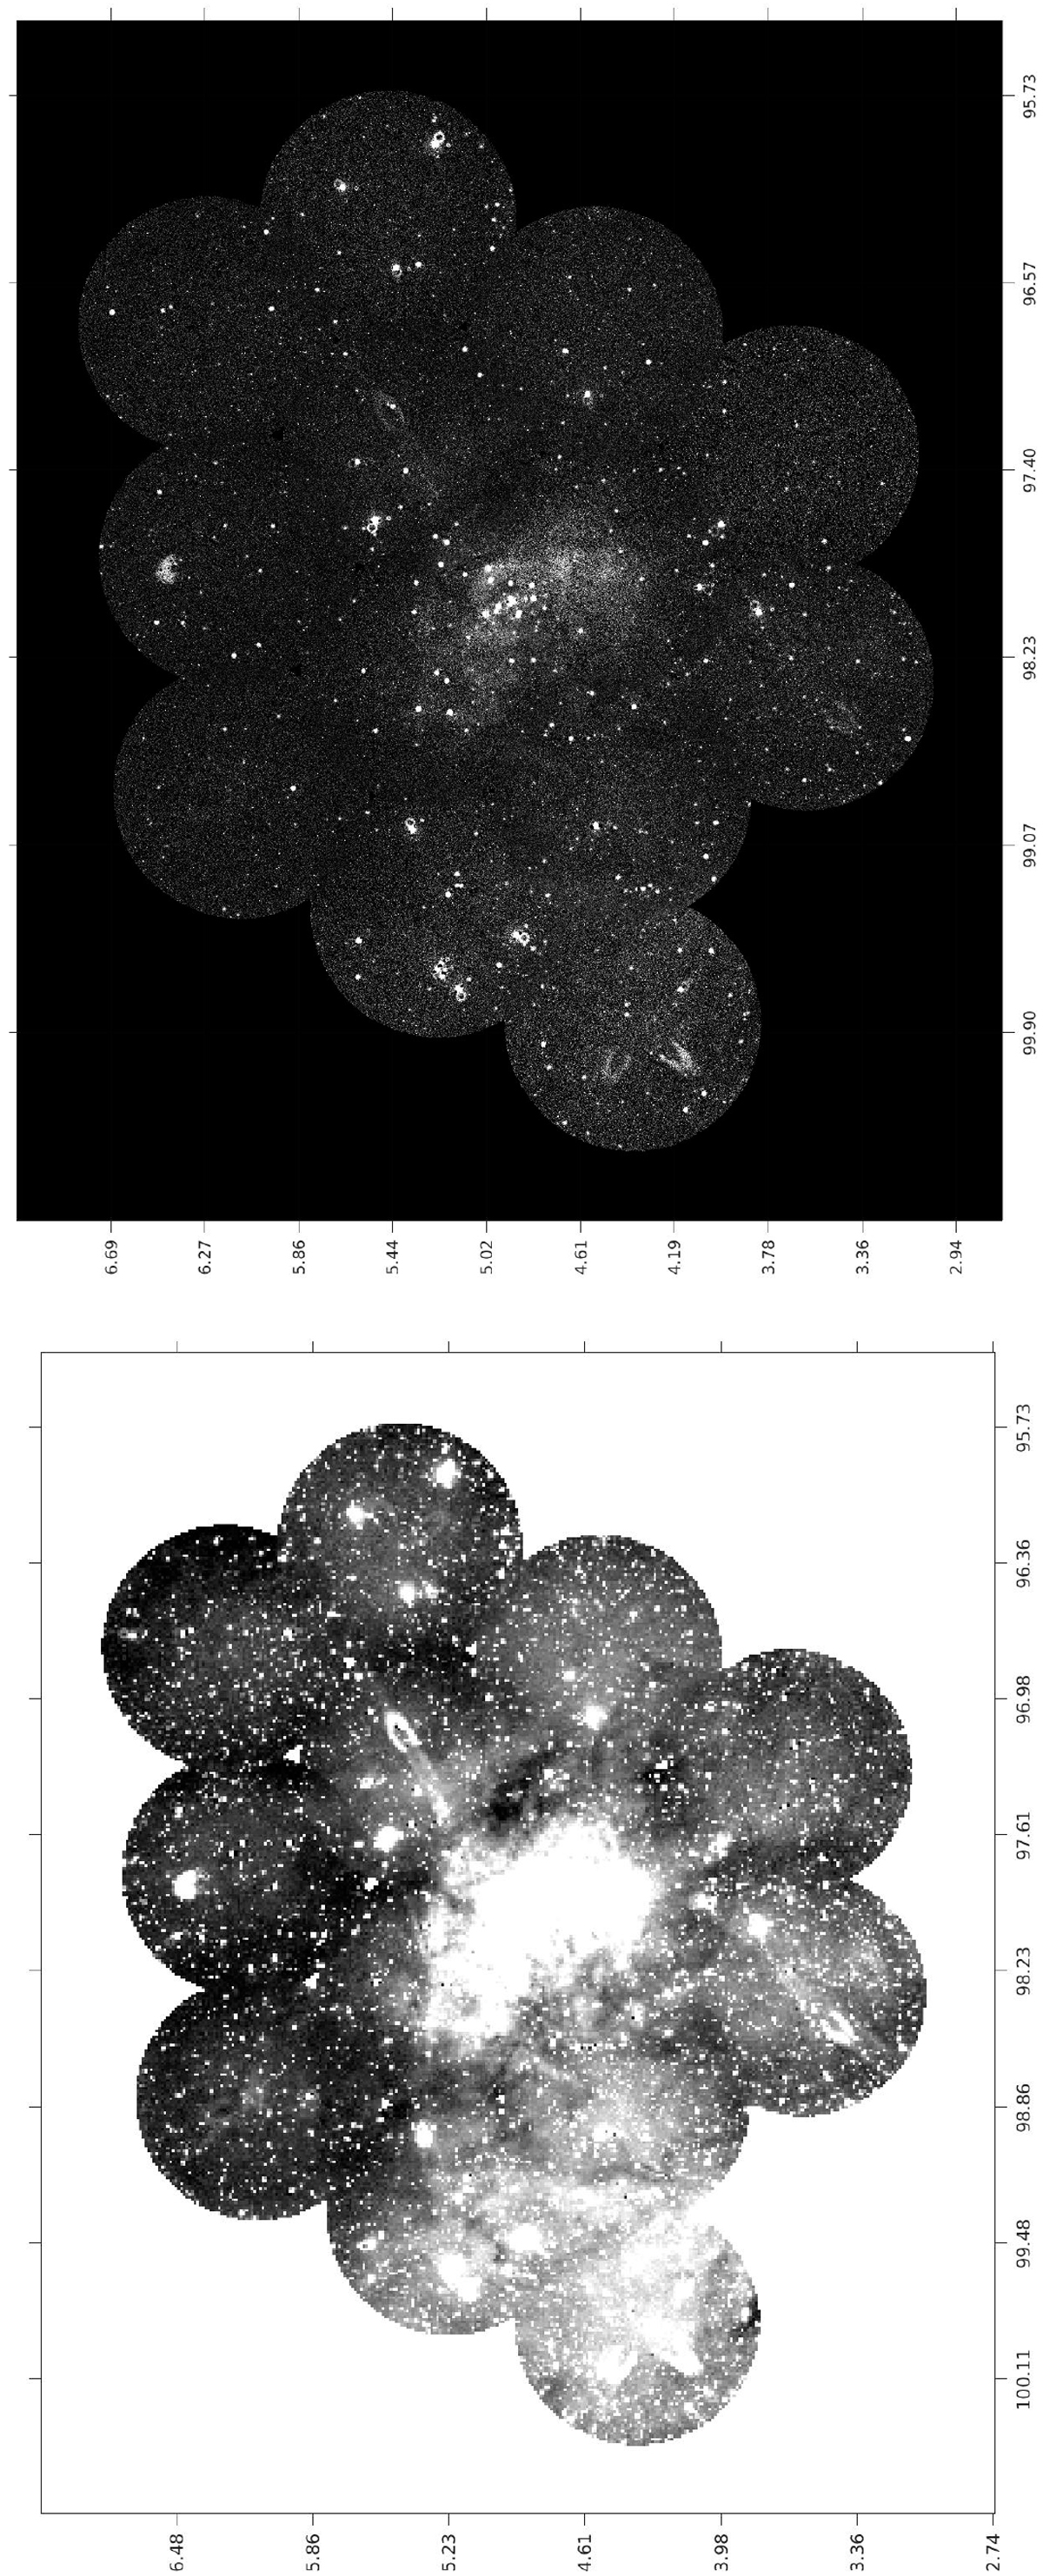
Rosette nebula as seen by GALEX in the NUV band (Rosette was not mapped in the FUV band). The image is a compositeof 13 NUV images assembled using the MOSAIX tool (Armengot et al. 2014). Top panel: high contrast image. Bottom panel: same image in logarithmic scale to enhance the structures at low signal level. Coordinates are ICRS: right ascension increases from right to left (in degrees) and declination from bottom to top.
Current usage metrics show cumulative count of Article Views (full-text article views including HTML views, PDF and ePub downloads, according to the available data) and Abstracts Views on Vision4Press platform.
Data correspond to usage on the plateform after 2015. The current usage metrics is available 48-96 hours after online publication and is updated daily on week days.
Initial download of the metrics may take a while.