Free Access
Fig. 6.
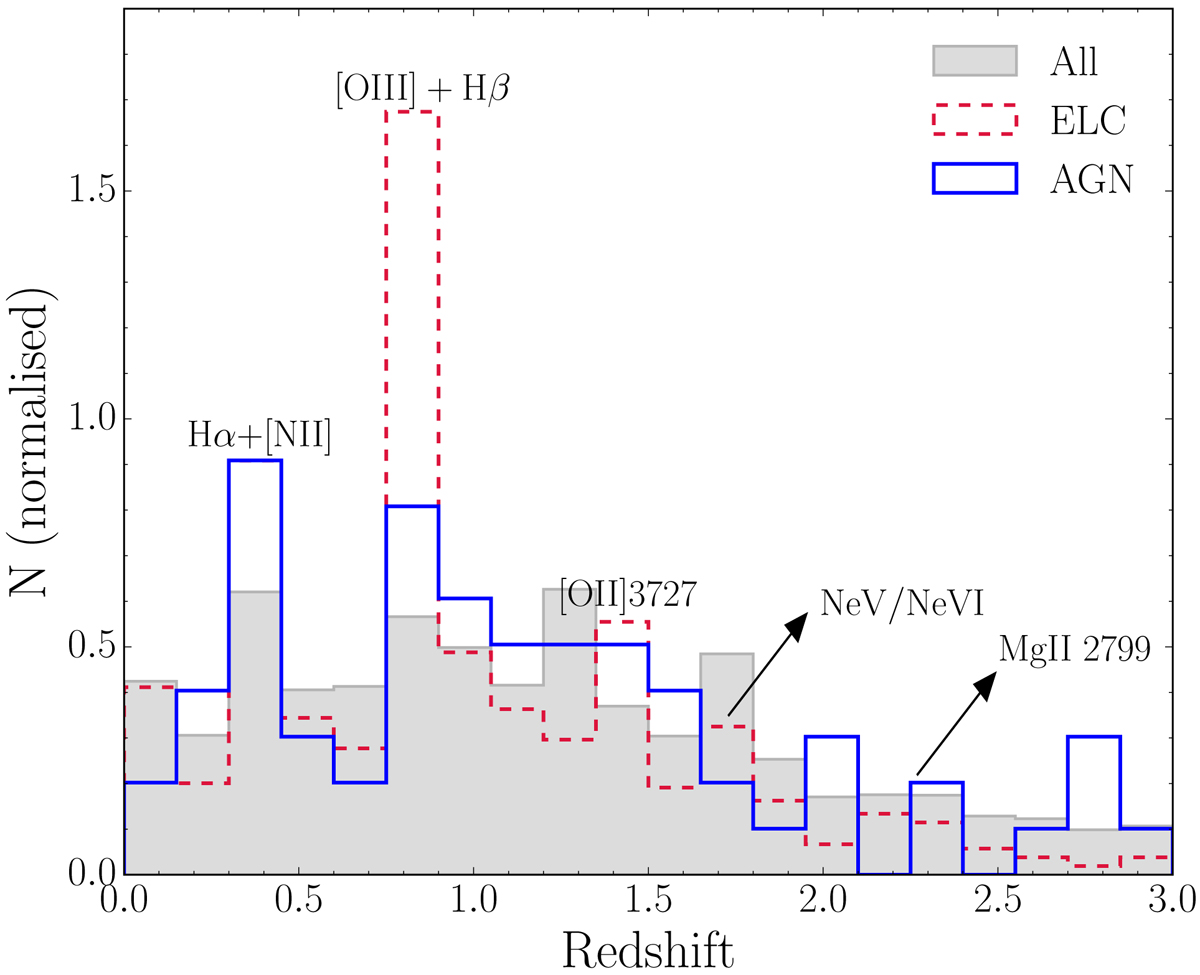
Distribution of redshifts (obtained with LePhare as described in Bongiovanni et al. 2019) for the whole sample of OTELO (grey), the emitting-line candidates (ELC, shown in red; see text for details), and the AGN sample (shown in blue). Some of the most intense emission lines in this spectral interval are displayed.
Current usage metrics show cumulative count of Article Views (full-text article views including HTML views, PDF and ePub downloads, according to the available data) and Abstracts Views on Vision4Press platform.
Data correspond to usage on the plateform after 2015. The current usage metrics is available 48-96 hours after online publication and is updated daily on week days.
Initial download of the metrics may take a while.