Fig. 4.
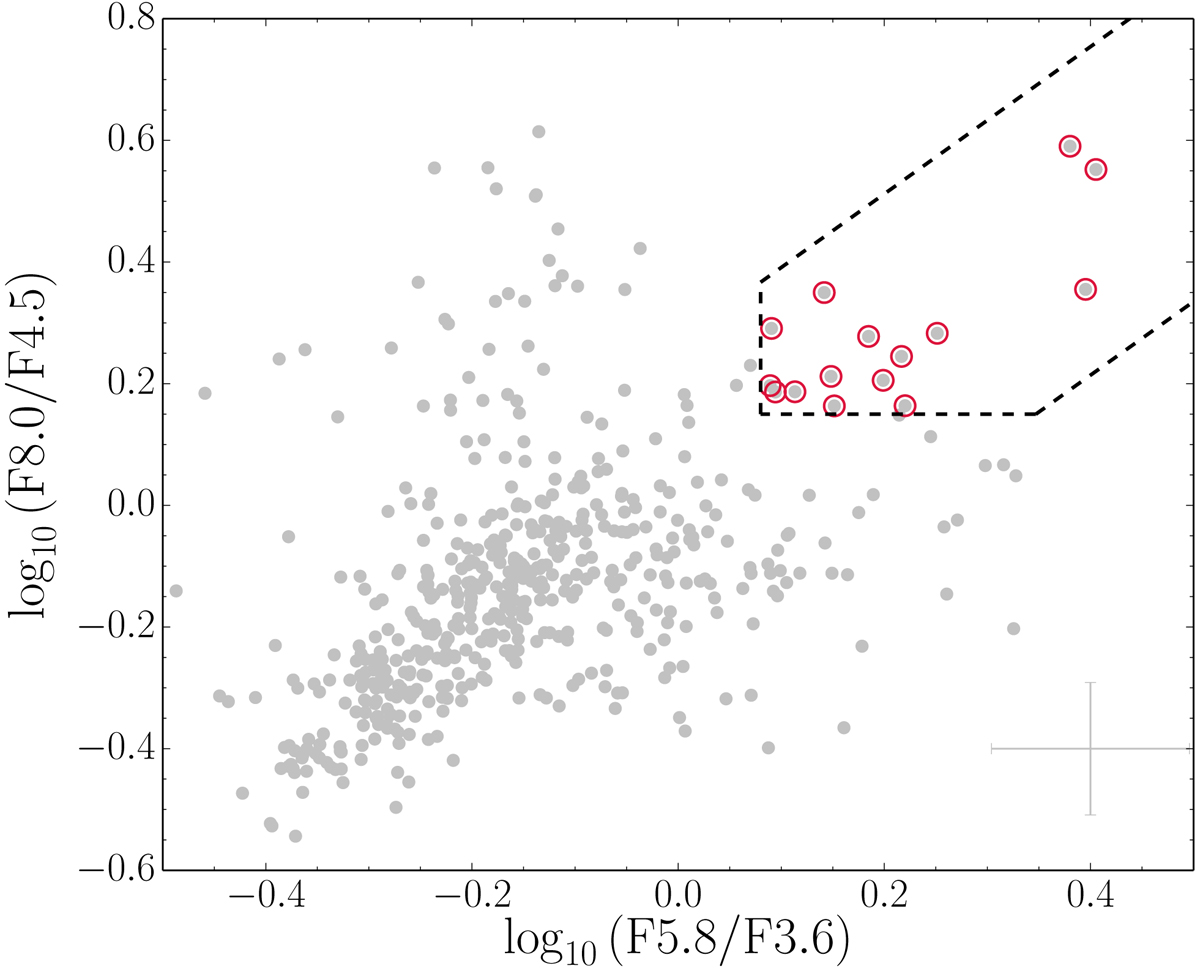
Revised Spitzer/IRAC criteria from Donley et al. (2012) to separate AGNs from SFGs. The x axis shows the ratio between the flux in the 5.8 μm band and the flux in the 3.6 μm band, while the y axis depicts the ratio between the flux in the 8.0 μm band and the flux in the 4.5 μm band. Grey dots are all the sources in the OTELO catalogue with information in the four IRAC bands. Black dashed lines correspond to the limits set by Donley et al. (2012) to select AGNs. Red circled sources are the 15 sources selected as AGNs in this way.
Current usage metrics show cumulative count of Article Views (full-text article views including HTML views, PDF and ePub downloads, according to the available data) and Abstracts Views on Vision4Press platform.
Data correspond to usage on the plateform after 2015. The current usage metrics is available 48-96 hours after online publication and is updated daily on week days.
Initial download of the metrics may take a while.