Fig. 2.
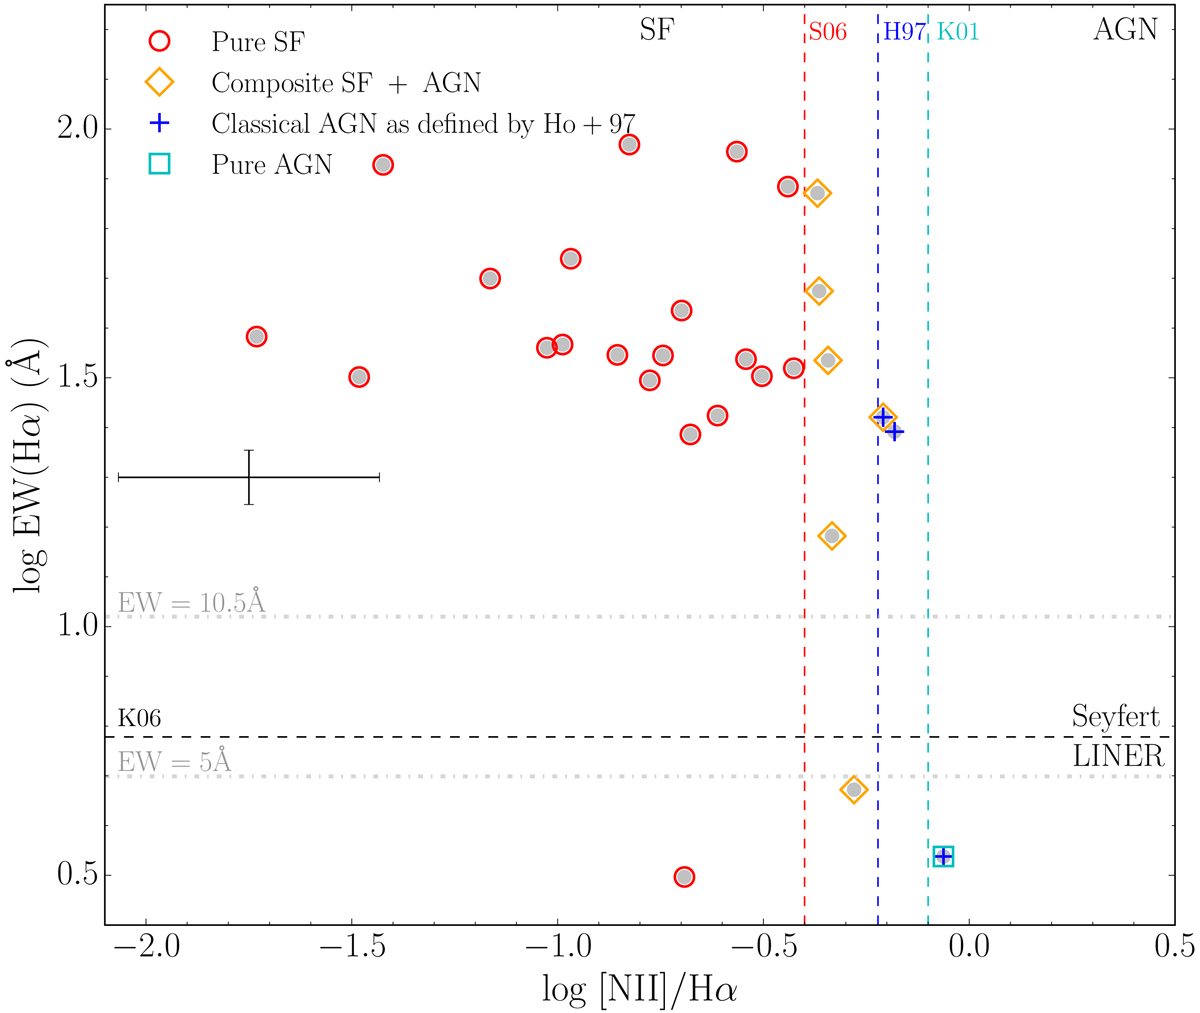
EWαn2 diagnostic diagram defined by Cid Fernandes et al. (2010) in order to distinguish SFGs from AGNs using emission lines in the optical. Pure SFGs (red circles) are separated from composite objects (SF+AGN, orange diamonds) according to Stasińska et al. (2006) (red dashed vertical line). Classical AGNs as defined by Ho et al. (1997) (blue dashed vertical line) are displayed with blue crosses. Pure AGNs according to Kewley et al. (2001) (cyan dashed vertical line) are represented in cyan squares. The black dashed horizontal line corresponds to the Seyfert/LINER separation criterion by Kewley et al. (2006). The two grey dashed-dotted horizontal lines mark our minimum detected EW(Hα) with a probability threshold of p ≥ 0.95 for objects with a PS continuum up to ∼10−18 erg s−1 cm−2 Å−1, and a EW(Hα) with p ≥ 0.50 for objects with a PS continuum up to ∼10−19 erg s−1 cm−2 Å−1 (see Ramón-Pérez et al. 2019). The error bars on the left-hand side of the plot represent the median of the relative errors of our Hα sample in this space.
Current usage metrics show cumulative count of Article Views (full-text article views including HTML views, PDF and ePub downloads, according to the available data) and Abstracts Views on Vision4Press platform.
Data correspond to usage on the plateform after 2015. The current usage metrics is available 48-96 hours after online publication and is updated daily on week days.
Initial download of the metrics may take a while.