Fig. A.1.
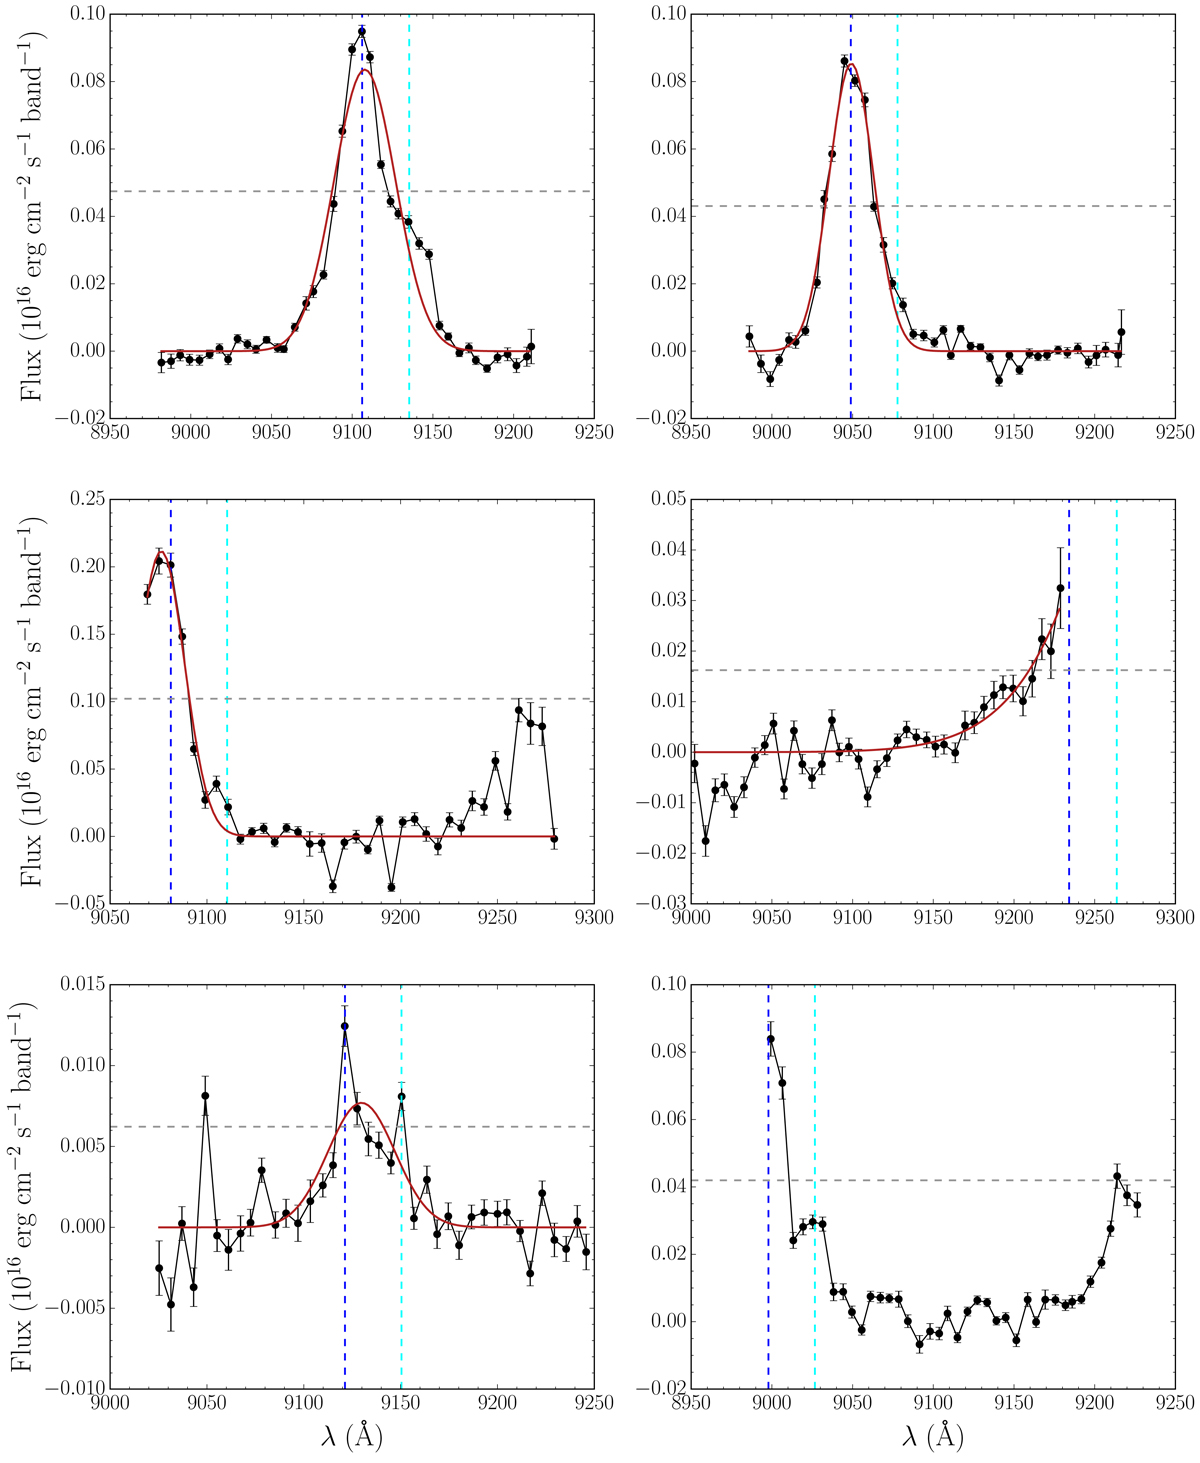
Objects from OTELO survey showing Hα+[NII] emission and classified as BLAGNs. The red lines show the best fit to a Gaussian profile, while the grey dashed lines represent half the maximum value of the pseudo-spectra. The blue and cyan vertical lines mark the positions of the Hα and [NII] emission lines, respectively. In the last case, no fitting could be made due to the truncation of the line. However, the object was included in the final sample because its width is comparable to the rest of the objects selected as BLAGNs.
Current usage metrics show cumulative count of Article Views (full-text article views including HTML views, PDF and ePub downloads, according to the available data) and Abstracts Views on Vision4Press platform.
Data correspond to usage on the plateform after 2015. The current usage metrics is available 48-96 hours after online publication and is updated daily on week days.
Initial download of the metrics may take a while.