Fig. 16.
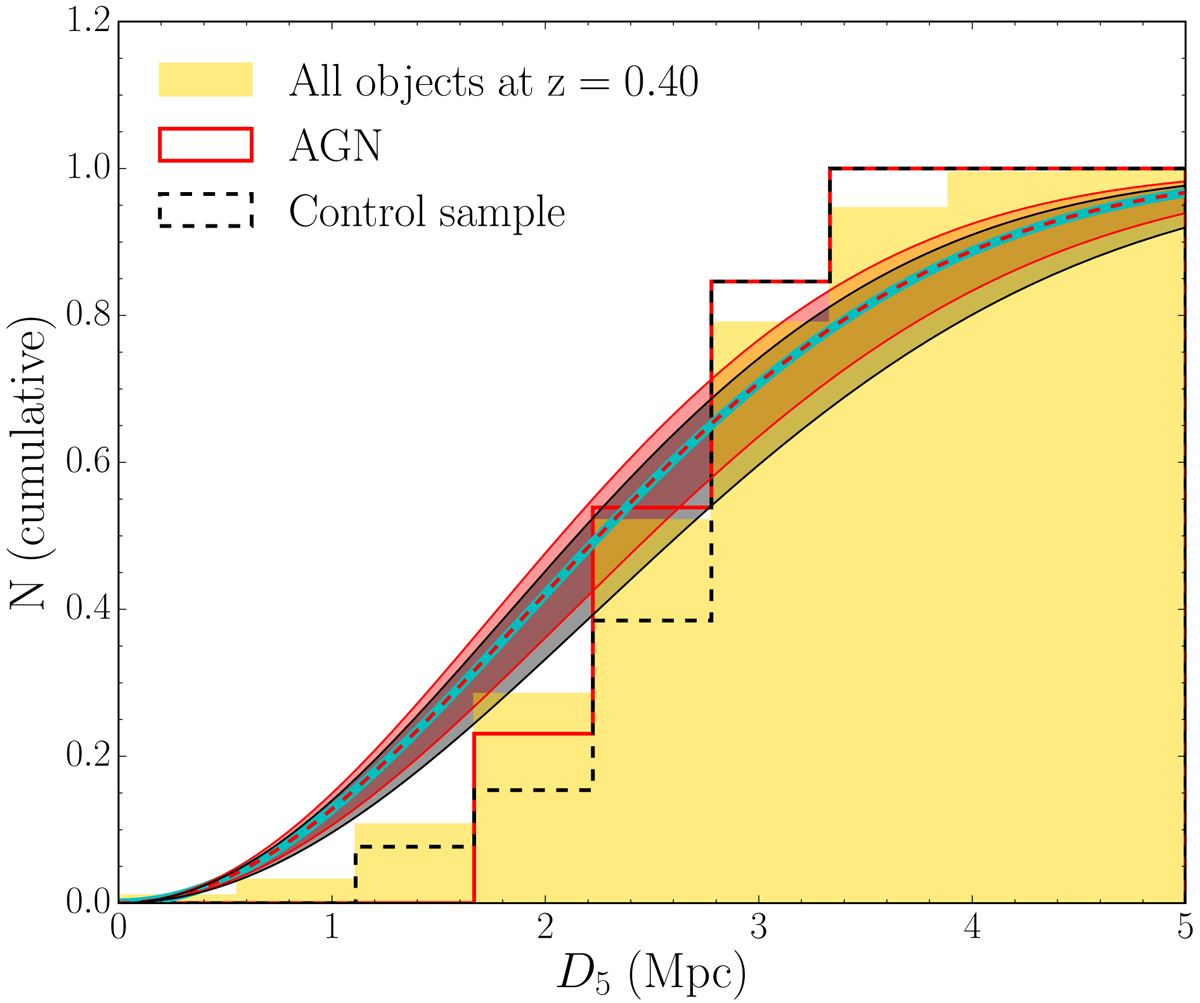
Cumulative and normalised distributions of D5 for the total sample of OTELO objects, the AGNs, and the control sample (non-AGNs). The yellow distribution is the distribution of all the objects at z ∼ 0.4 and the cyan solid line is its Poissonian fit. The step histograms in red and black represent the distributions of D5 for the AGN and non-AGN samples, respectively, while the corresponding dashed lines are their Poissonian fits. The filled bands show the propagation of statistical errors in the Poissonian fit.
Current usage metrics show cumulative count of Article Views (full-text article views including HTML views, PDF and ePub downloads, according to the available data) and Abstracts Views on Vision4Press platform.
Data correspond to usage on the plateform after 2015. The current usage metrics is available 48-96 hours after online publication and is updated daily on week days.
Initial download of the metrics may take a while.