Fig. 12.
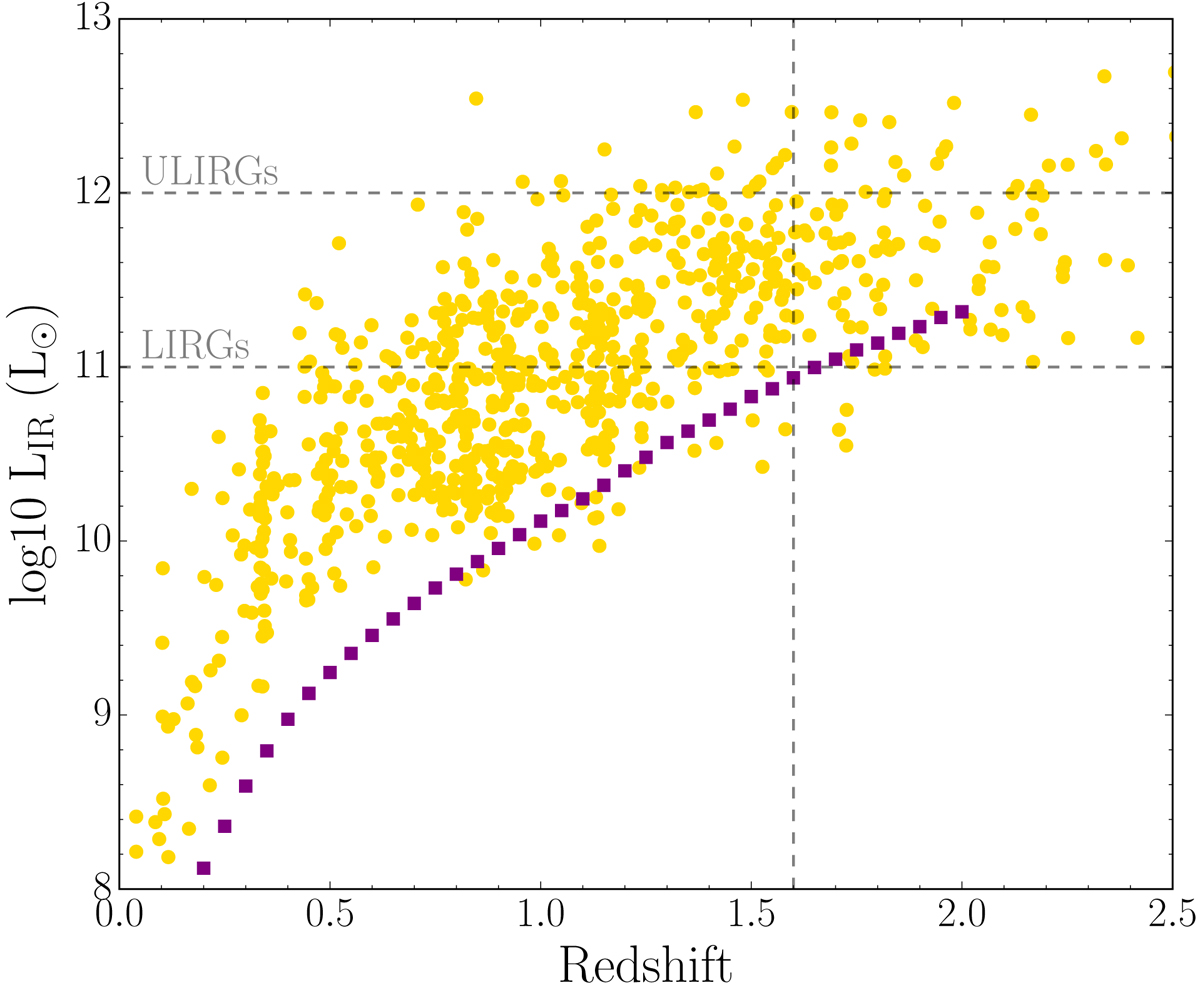
Infrared luminosity in OTELO as a function of redshift. Yellow dots represent the IR luminosity of OTELO sources for which 24 μm photometry is available. Purple squares represent the minimum detectable LIR given the sensitivity limits in our catalogue (see text for details). Horizontal lines indicate the LIRGs and ULIRGs limits. The vertical line shows the redshift up to which the sample of LIRGs is complete in our survey (z = 1.6).
Current usage metrics show cumulative count of Article Views (full-text article views including HTML views, PDF and ePub downloads, according to the available data) and Abstracts Views on Vision4Press platform.
Data correspond to usage on the plateform after 2015. The current usage metrics is available 48-96 hours after online publication and is updated daily on week days.
Initial download of the metrics may take a while.