Fig. 1.
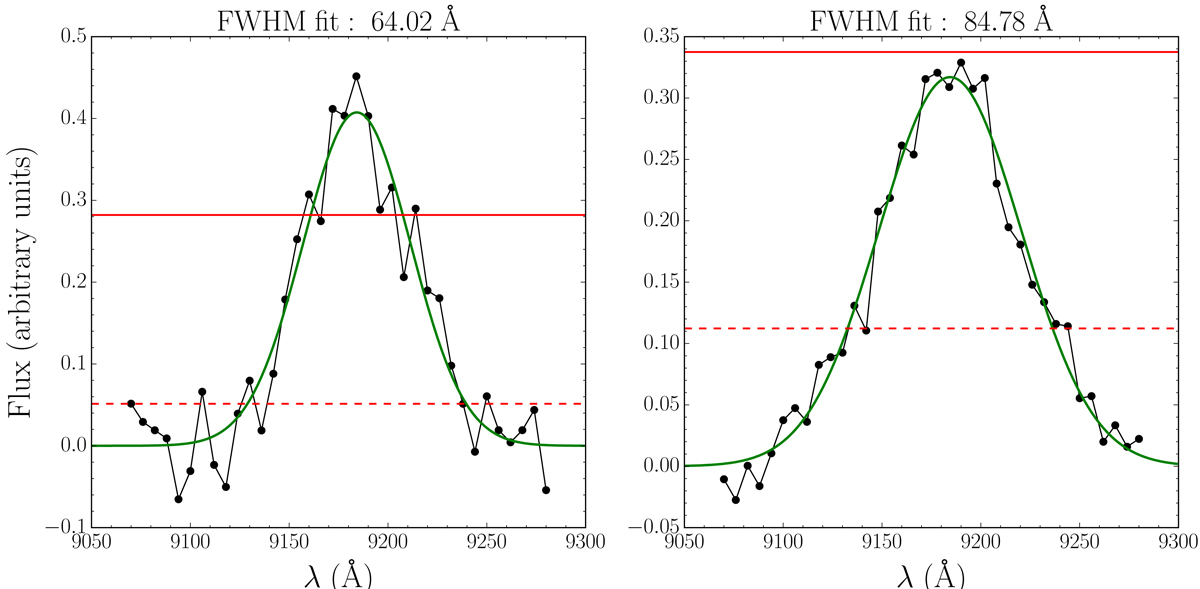
Simulated pseudo-spectra (black dots) of Hα+[NII] lines with different widths after being convolved to the TF spectral response. The green lines represent the best Gaussian fit to each pseudo-spectrum and the titles describe the corresponding FWHM. The red dashed lines represent the pseudo-continuum, fcont, defined as the median value of the pseudo-spectrum points that remain within 2σ of the median value of the whole pseudo-spectrum. The red continuous lines represent fcont + 2σcont, where σcont is the standard deviation of the pseudo-continuum points. The automatic algorithm used in Ramón-Pérez et al. (2019) efficiently detects broad lines as emitting lines for widths up to ∼84 Å. In the left panel, with a FHWM of 64.02 Å, the broad line is detected. On the contrary, the line in the right panel is so broad (FWHM of 84.78 Å) that it is not recognised.
Current usage metrics show cumulative count of Article Views (full-text article views including HTML views, PDF and ePub downloads, according to the available data) and Abstracts Views on Vision4Press platform.
Data correspond to usage on the plateform after 2015. The current usage metrics is available 48-96 hours after online publication and is updated daily on week days.
Initial download of the metrics may take a while.