Fig. 5.
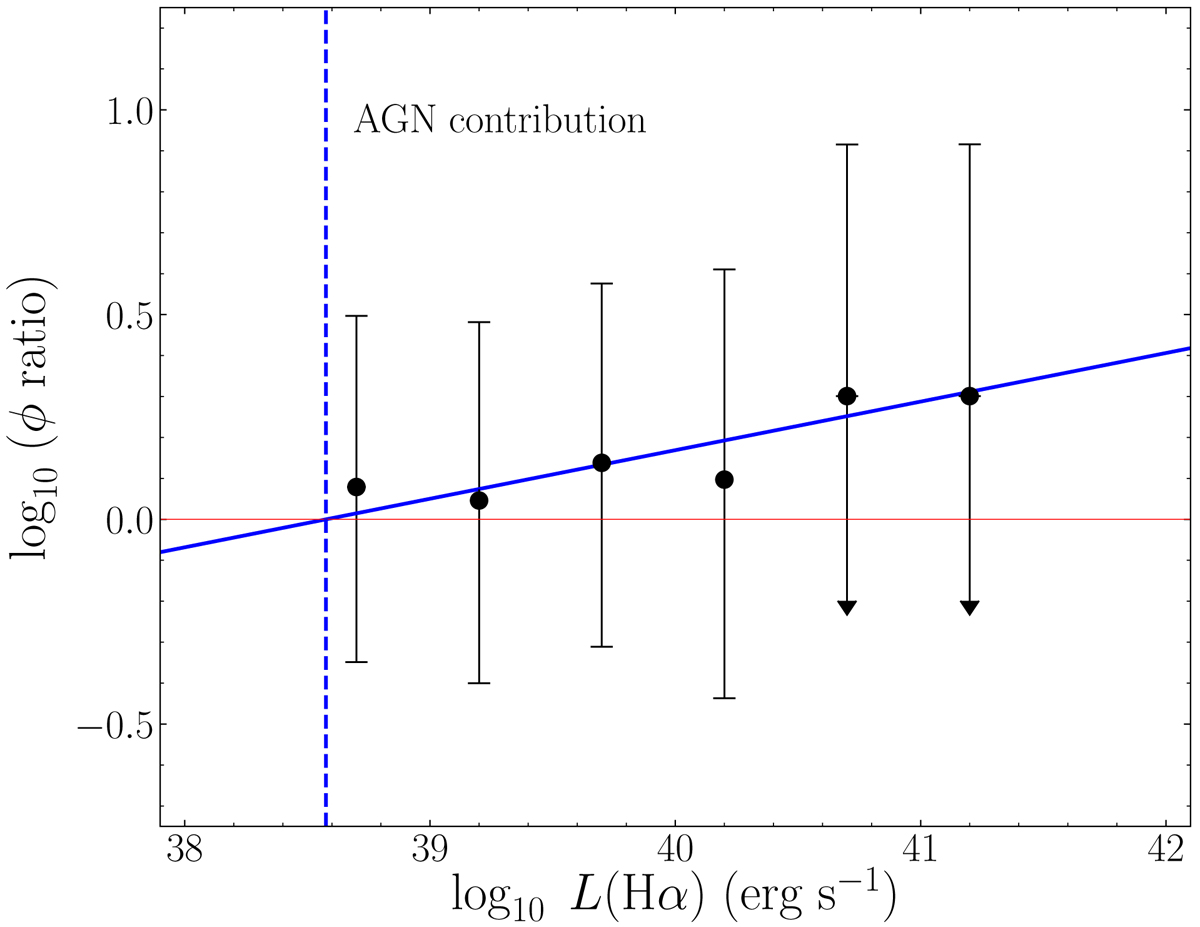
Ratio between the OTELO Hα LF of the total sample of emitters at z ∼ 0.40 and that of the star-forming galaxies only. Bars are the sum in quadrature of the Poissonian errors of both LF, as given in Table 2. The blue solid line represents a error-weighted linear fitting to the ratio values. The red horizontal line corresponds to a ratio equals unity. The blue dashed vertical line represents the luminosity above which the AGN contribution becomes relevant.
Current usage metrics show cumulative count of Article Views (full-text article views including HTML views, PDF and ePub downloads, according to the available data) and Abstracts Views on Vision4Press platform.
Data correspond to usage on the plateform after 2015. The current usage metrics is available 48-96 hours after online publication and is updated daily on week days.
Initial download of the metrics may take a while.