Fig. 4.
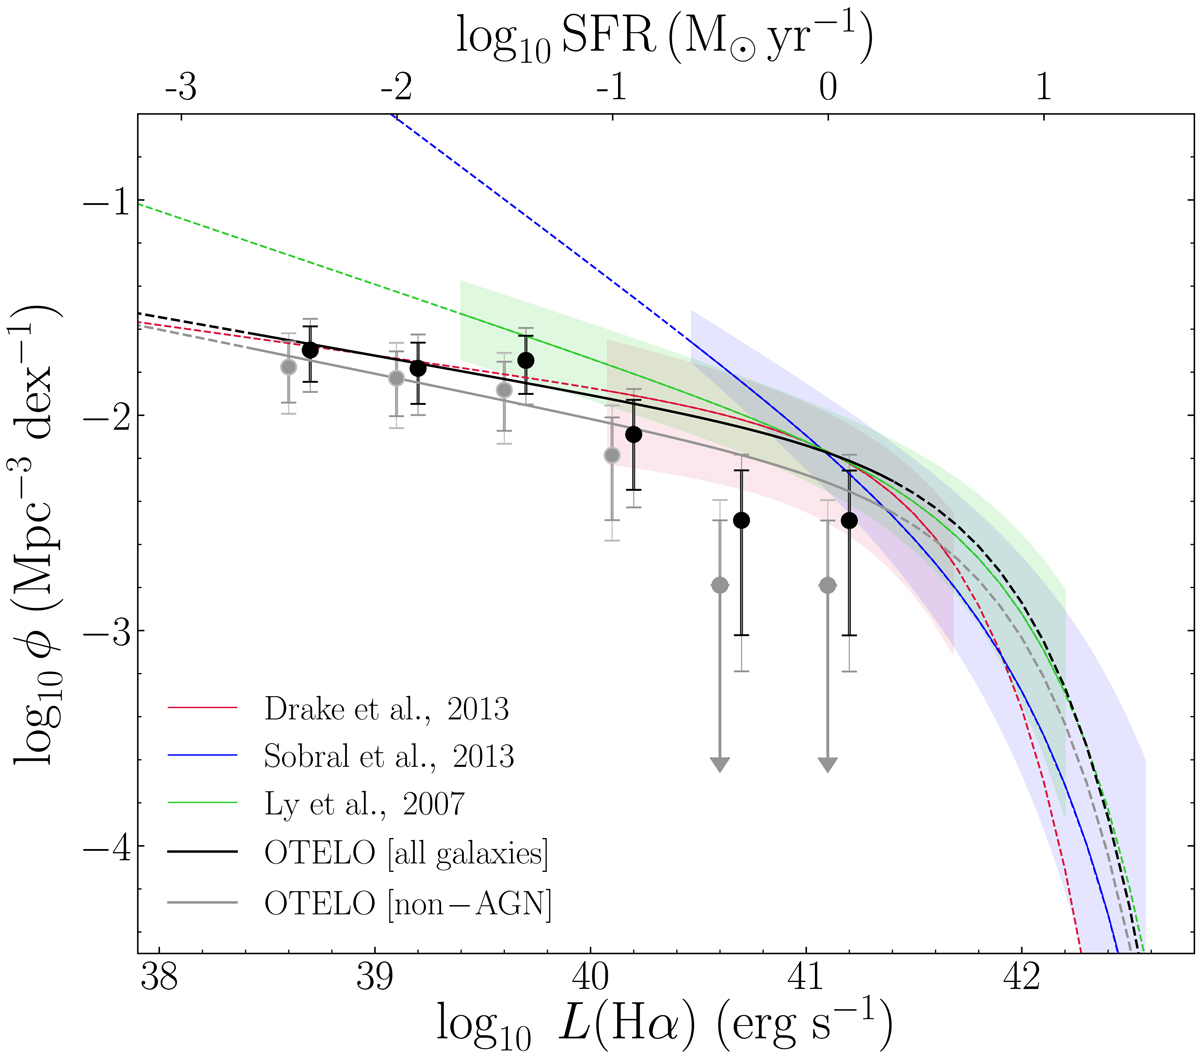
Completeness and dust extinction-corrected Hα LFs at z ∼ 0.40. The black line corresponds to the LF fitting for the whole sample of OTELO emitters at that redshift, which are represented with black dots, while the grey line is the LF fitting for the non-AGN population (grey circles). For the sake of clarity, grey circles are displaced −0.1 dex in luminosity with respect to black circles. Shorter error bars are Poissonian and the larger error bars have the cosmic variance uncertainties evenly added in quadrature (see text for details). The Hα LFs of Drake et al. (2013), Sobral et al. (2013), and Ly et al. (2007) are plotted in red, blue, and green, respectively. In each case, the solid line represents their sampled luminosity interval, while the dashed line is the extrapolation of their Schechter function fit. The coloured regions are the maximum envelopes that enclose binned data and their corresponding errors as reported by the cited authors.
Current usage metrics show cumulative count of Article Views (full-text article views including HTML views, PDF and ePub downloads, according to the available data) and Abstracts Views on Vision4Press platform.
Data correspond to usage on the plateform after 2015. The current usage metrics is available 48-96 hours after online publication and is updated daily on week days.
Initial download of the metrics may take a while.