Fig. 2.
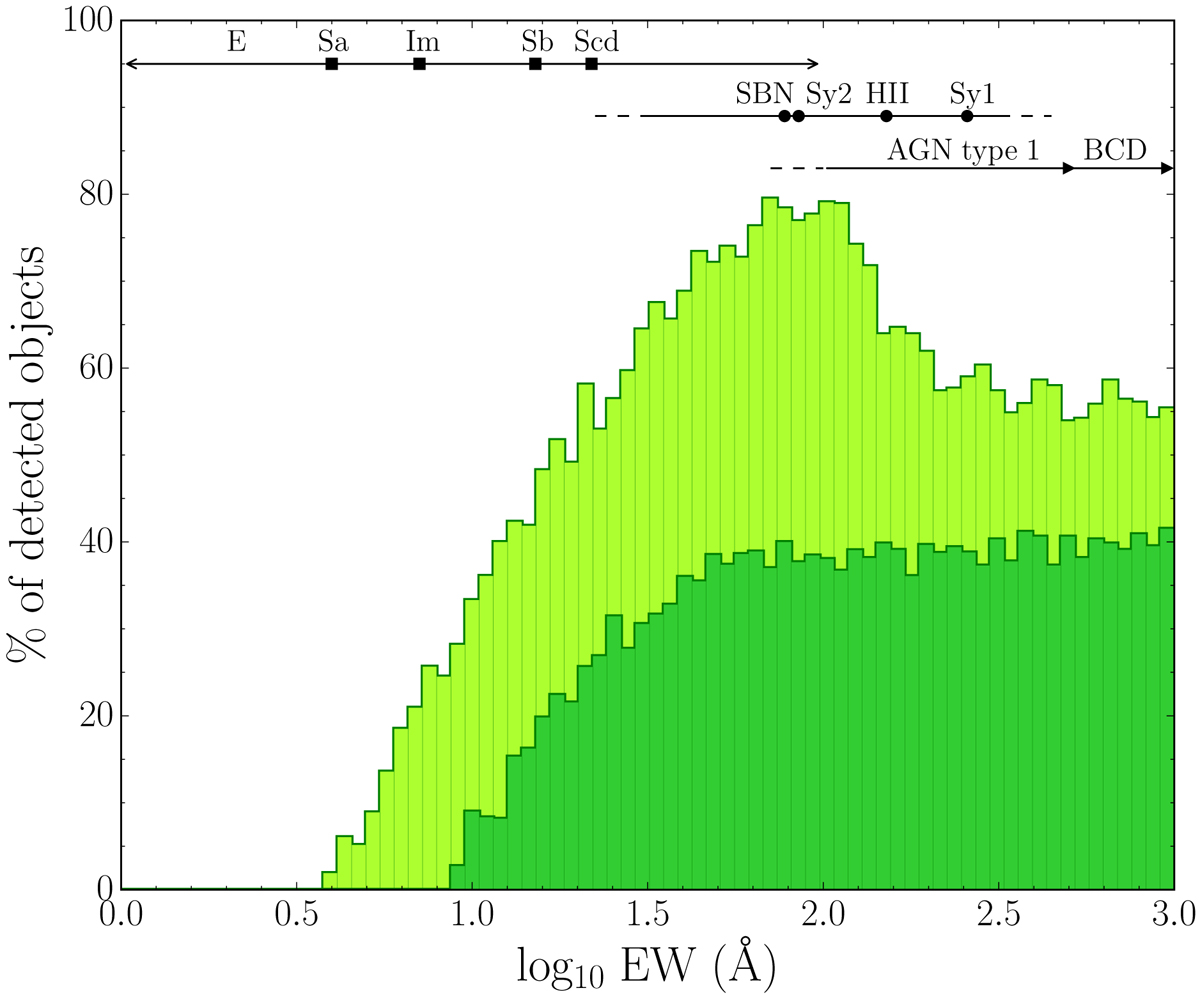
Percentage of detected objects in the simulation depending on the EW of the input Hα Gaussian line. Light green: p ≥ 0.50 probability threshold. Dark green: p ≥ 0.95 probability threshold. Typical values of Hα EWs for multiple astrophysical objects are also indicated. Black squares: median values of EW as in Gavazzi et al. (2006). Black circles: mean values as in Gallego et al. (1997). Black triangles: maximum values from Stern & Laor (2012) and Gil de Paz et al. (2003).
Current usage metrics show cumulative count of Article Views (full-text article views including HTML views, PDF and ePub downloads, according to the available data) and Abstracts Views on Vision4Press platform.
Data correspond to usage on the plateform after 2015. The current usage metrics is available 48-96 hours after online publication and is updated daily on week days.
Initial download of the metrics may take a while.