Free Access
Fig. 1.
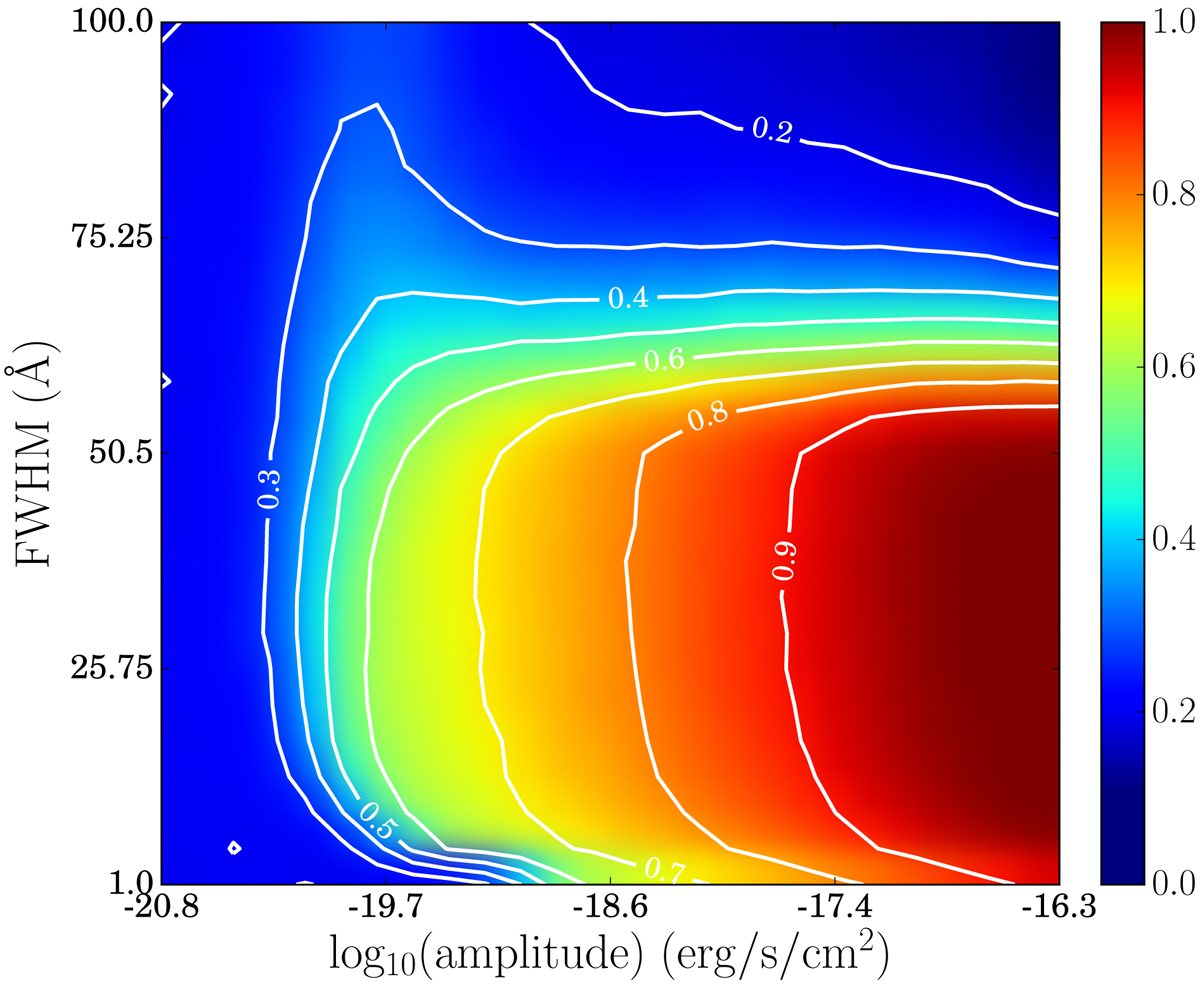
Mean value of detection in the 500 runs of the simulation (0: never detected as emitter, 1: always detected as emitter), given the FWHM and the amplitude of the Hα Gaussian. The continuum variable has been collapsed in the plane of the other two. White lines represent the detection probability contours.
Current usage metrics show cumulative count of Article Views (full-text article views including HTML views, PDF and ePub downloads, according to the available data) and Abstracts Views on Vision4Press platform.
Data correspond to usage on the plateform after 2015. The current usage metrics is available 48-96 hours after online publication and is updated daily on week days.
Initial download of the metrics may take a while.