Fig. 27.
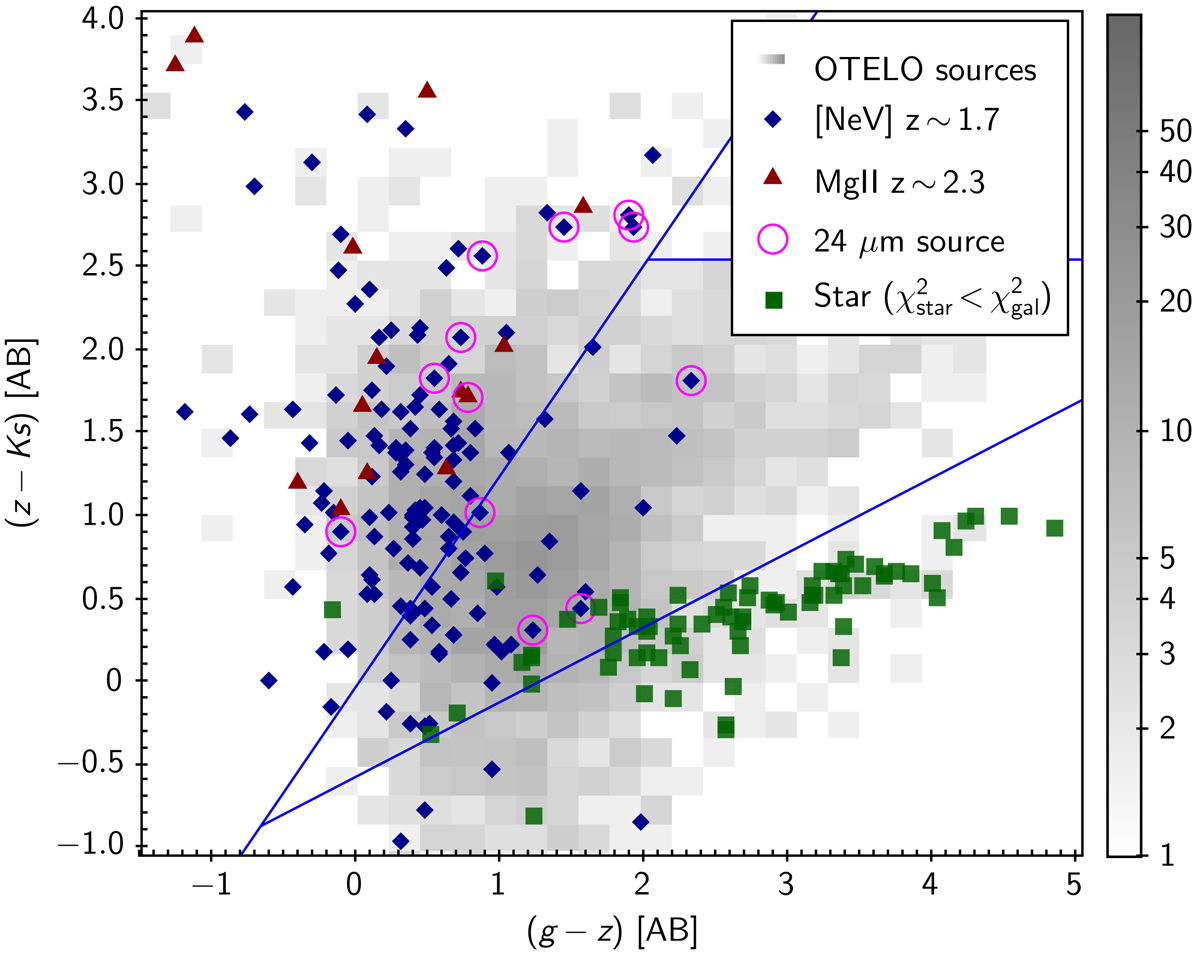
(z − KS) versus (g − z) colour–colour diagram showing the [NeV]λ3426 (filled diamonds) and MgII (filled triangles) emission-line candidates selected as explained in the text. This diagram is based on the adaptation (Arcila-Osejo & Sawicki 2013) for CFHTLS and WIRDS data of the BzK technique (Daddi et al. 2004) used to select star-forming galaxies at 1.4 < z < 2.5. According to this, the left side of the diagram would be occupied by the latter, and the central triangular region by passively evolved galaxies at z < 1.4. The colour cut between these regions matches with the reddening axis. The lowest region of the diagram would be populated by stars. The OTELO star candidates, obtained as described in Sect. 6.1, are symbolized by filled squares. The grey background grid represents the OTELO sources and the open circles represent those sources detected with MIPS 24 μm.
Current usage metrics show cumulative count of Article Views (full-text article views including HTML views, PDF and ePub downloads, according to the available data) and Abstracts Views on Vision4Press platform.
Data correspond to usage on the plateform after 2015. The current usage metrics is available 48-96 hours after online publication and is updated daily on week days.
Initial download of the metrics may take a while.