Fig. 26.
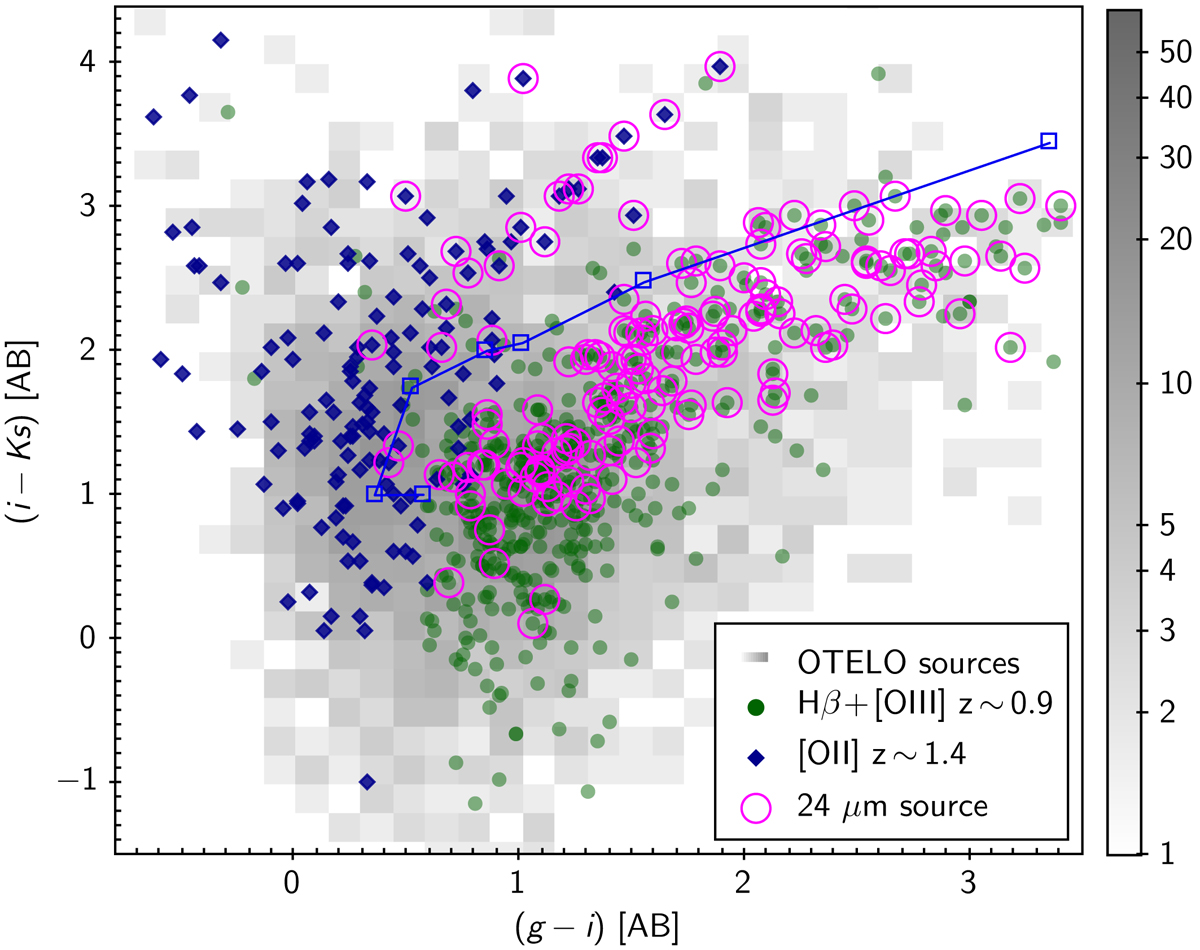
(i − KS) versus (g − i) colour-colour diagram showing the Hβ+[OIII]λ4959,5007 (filled circles) and [OII]λ3726,3729 (filled diamonds) emission-line candidates at z ∼ 0.9 and 1.4, respectively, selected as explained in the text. The grey background grid represents the OTELO sources and the open circles represent those sources detected with MIPS 24 μm. As a reference, the blue line represents a colour sequence of selected galaxy templates, described in Sect. 5.5, from E/S0 type to SB1 (open squares) at redshift z = 1.15 and E(B − V) = 0. The reddest segment of this sequence is concurrent with the intrinsic attenuation axis.
Current usage metrics show cumulative count of Article Views (full-text article views including HTML views, PDF and ePub downloads, according to the available data) and Abstracts Views on Vision4Press platform.
Data correspond to usage on the plateform after 2015. The current usage metrics is available 48-96 hours after online publication and is updated daily on week days.
Initial download of the metrics may take a while.