Fig. 23.
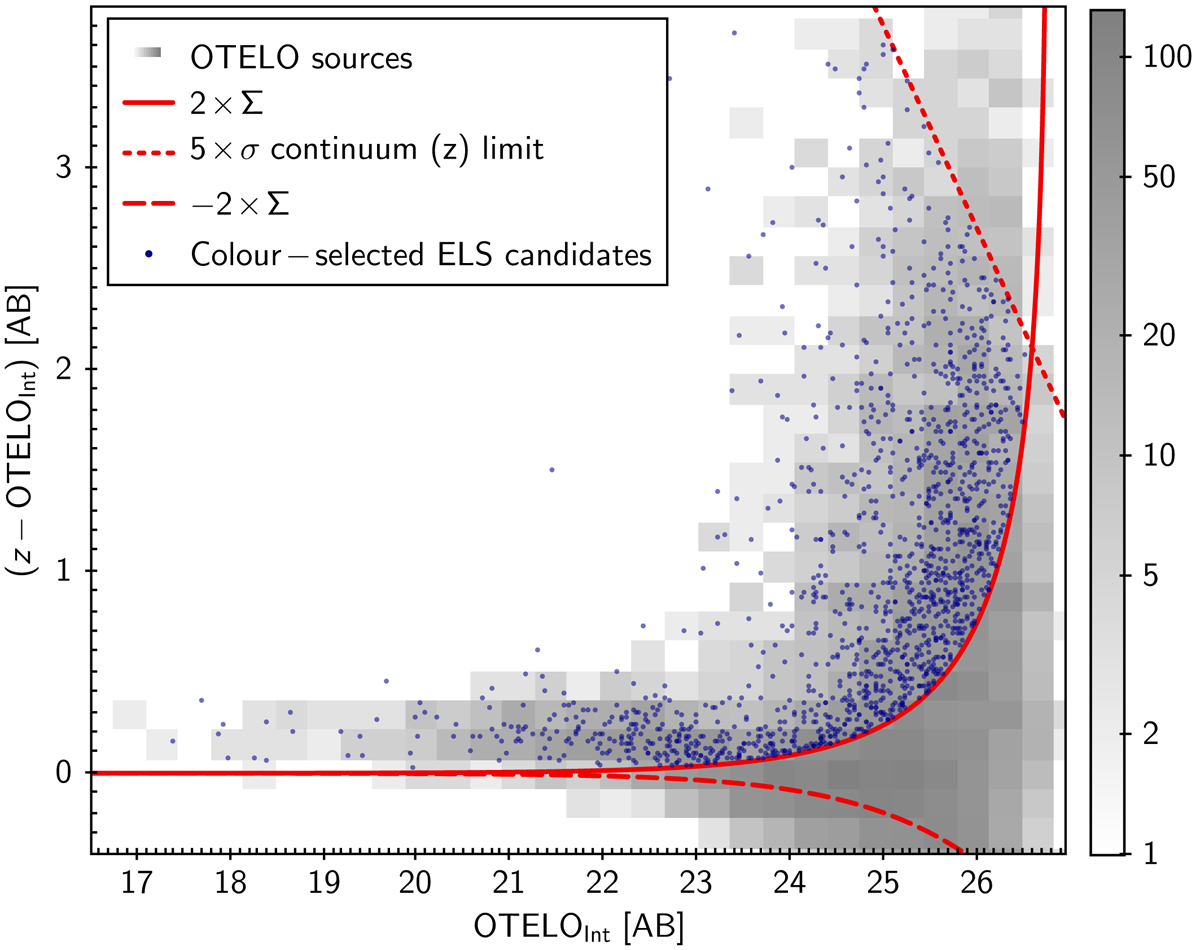
A (z-OTELOInt) colour-magnitude diagram used for a selection of ELS complementary to the preliminary one based on pseudo-spectra. The candidates are represented by blue dots. This selection is bounded by a 2-Σ isoline of colour significance, and a 5-Σ limit in z (dotted line). All fluxes correspond to the DETMODEL measurements. OTELOInt flux is measured on the OTELO-Deep image.
Current usage metrics show cumulative count of Article Views (full-text article views including HTML views, PDF and ePub downloads, according to the available data) and Abstracts Views on Vision4Press platform.
Data correspond to usage on the plateform after 2015. The current usage metrics is available 48-96 hours after online publication and is updated daily on week days.
Initial download of the metrics may take a while.