Fig. 17.
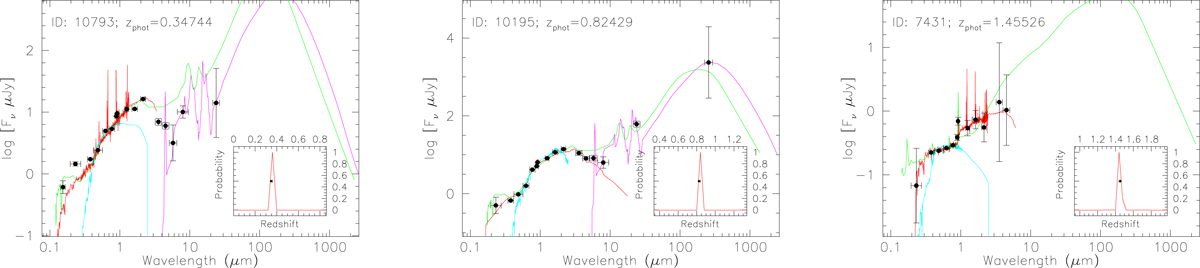
Examples of SED fitting performed by LePhare in order to obtain photometric redshifts. From left to right panels: OTELO sources with ID 10793, 10195, and 7431 at z ∼ 0.35, 0.82 and 1.46, respectively. Black dots are the observed fluxes of the source (including (OTELOInt data), and their errors are given by vertical bars. Horizontal bars represent the filter widths. The red curve represent the best-fitting galaxy template from which the primary solution of the photometric redshift is obtained. The blue spectrum represent the stellar template that best fits the observed SED, while the pink one corresponds to the best fit of the Chary & Elbaz (2001) templates of the infrared part of the SED (when applicable) for the photometric redshift obtained. The spectrum in green is the best alternative (QSO) photo-z solution using Polletta et al. (2007) templates.
Current usage metrics show cumulative count of Article Views (full-text article views including HTML views, PDF and ePub downloads, according to the available data) and Abstracts Views on Vision4Press platform.
Data correspond to usage on the plateform after 2015. The current usage metrics is available 48-96 hours after online publication and is updated daily on week days.
Initial download of the metrics may take a while.