Fig. 13.
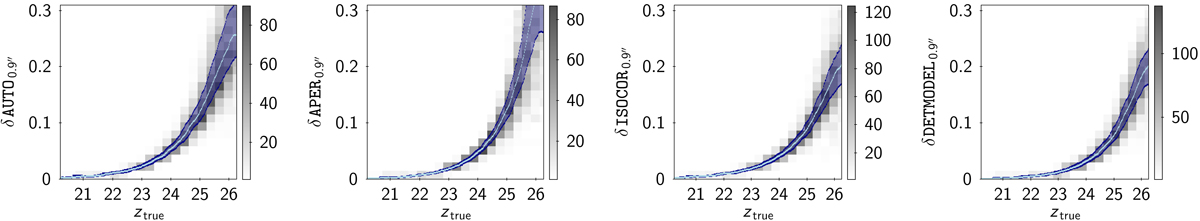
Distribution of photometric errors from measurements on the arbitrary z-band image with mean FWHM = 0.9″ for the set of photometric parameters (AUTO, APER, ISOCOR and DETMODEL) discussed in text (and also presented in Figs. 14 and 15). Light blue tracks represent the running median of the distributions. Very similar trends (not shown) were also found for the two extreme mean FWHMs (0.7″ and 1.1″).
Current usage metrics show cumulative count of Article Views (full-text article views including HTML views, PDF and ePub downloads, according to the available data) and Abstracts Views on Vision4Press platform.
Data correspond to usage on the plateform after 2015. The current usage metrics is available 48-96 hours after online publication and is updated daily on week days.
Initial download of the metrics may take a while.