Fig. 1.
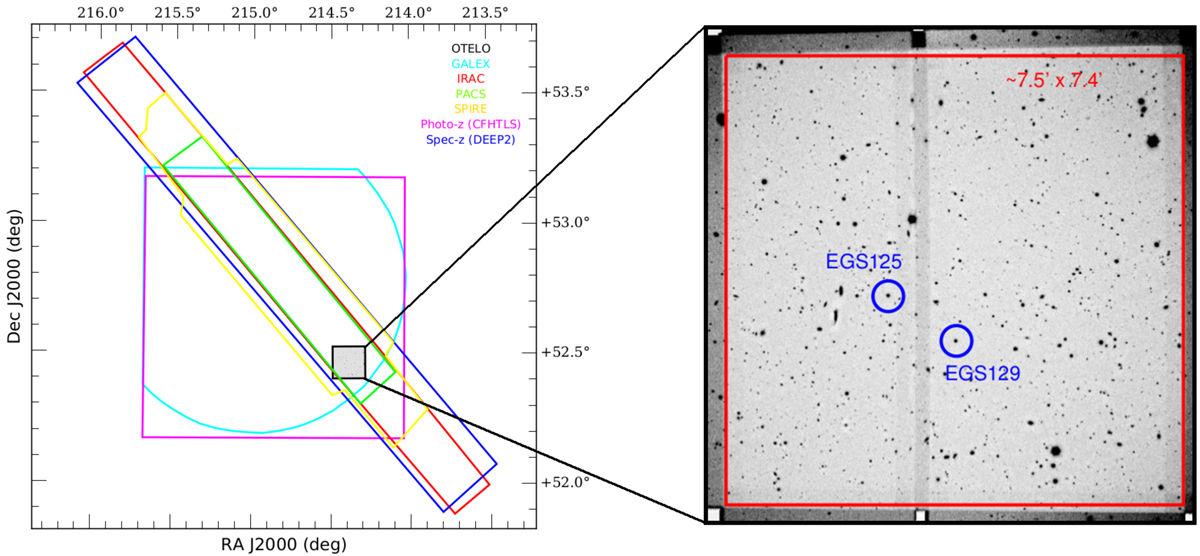
Spatial distribution boundaries of the UV, optical, IR, and spectroscopic redshift data used to build OTELO’s multi-wavelength catalogue (left panel). In black: the OTELO raw field, cyan: GALEX, red: IRAC, green: PACS, yellow: SPIRE, magenta: photo-z (CFHTLS), blue: spec-z (DEEP2). The right panel expands the surveyed area, showing the coadded RTF data of OTELO with its weight map (see Sect. 4.1 for details) overlapped in order to highlight the survey sensitivity footprint. The red polygon defines the survey’s final area (7.5′ × 7.4′). Blue circles indicate the position of the flux calibration stars (Sect. 4.4).
Current usage metrics show cumulative count of Article Views (full-text article views including HTML views, PDF and ePub downloads, according to the available data) and Abstracts Views on Vision4Press platform.
Data correspond to usage on the plateform after 2015. The current usage metrics is available 48-96 hours after online publication and is updated daily on week days.
Initial download of the metrics may take a while.