Fig. A.1.
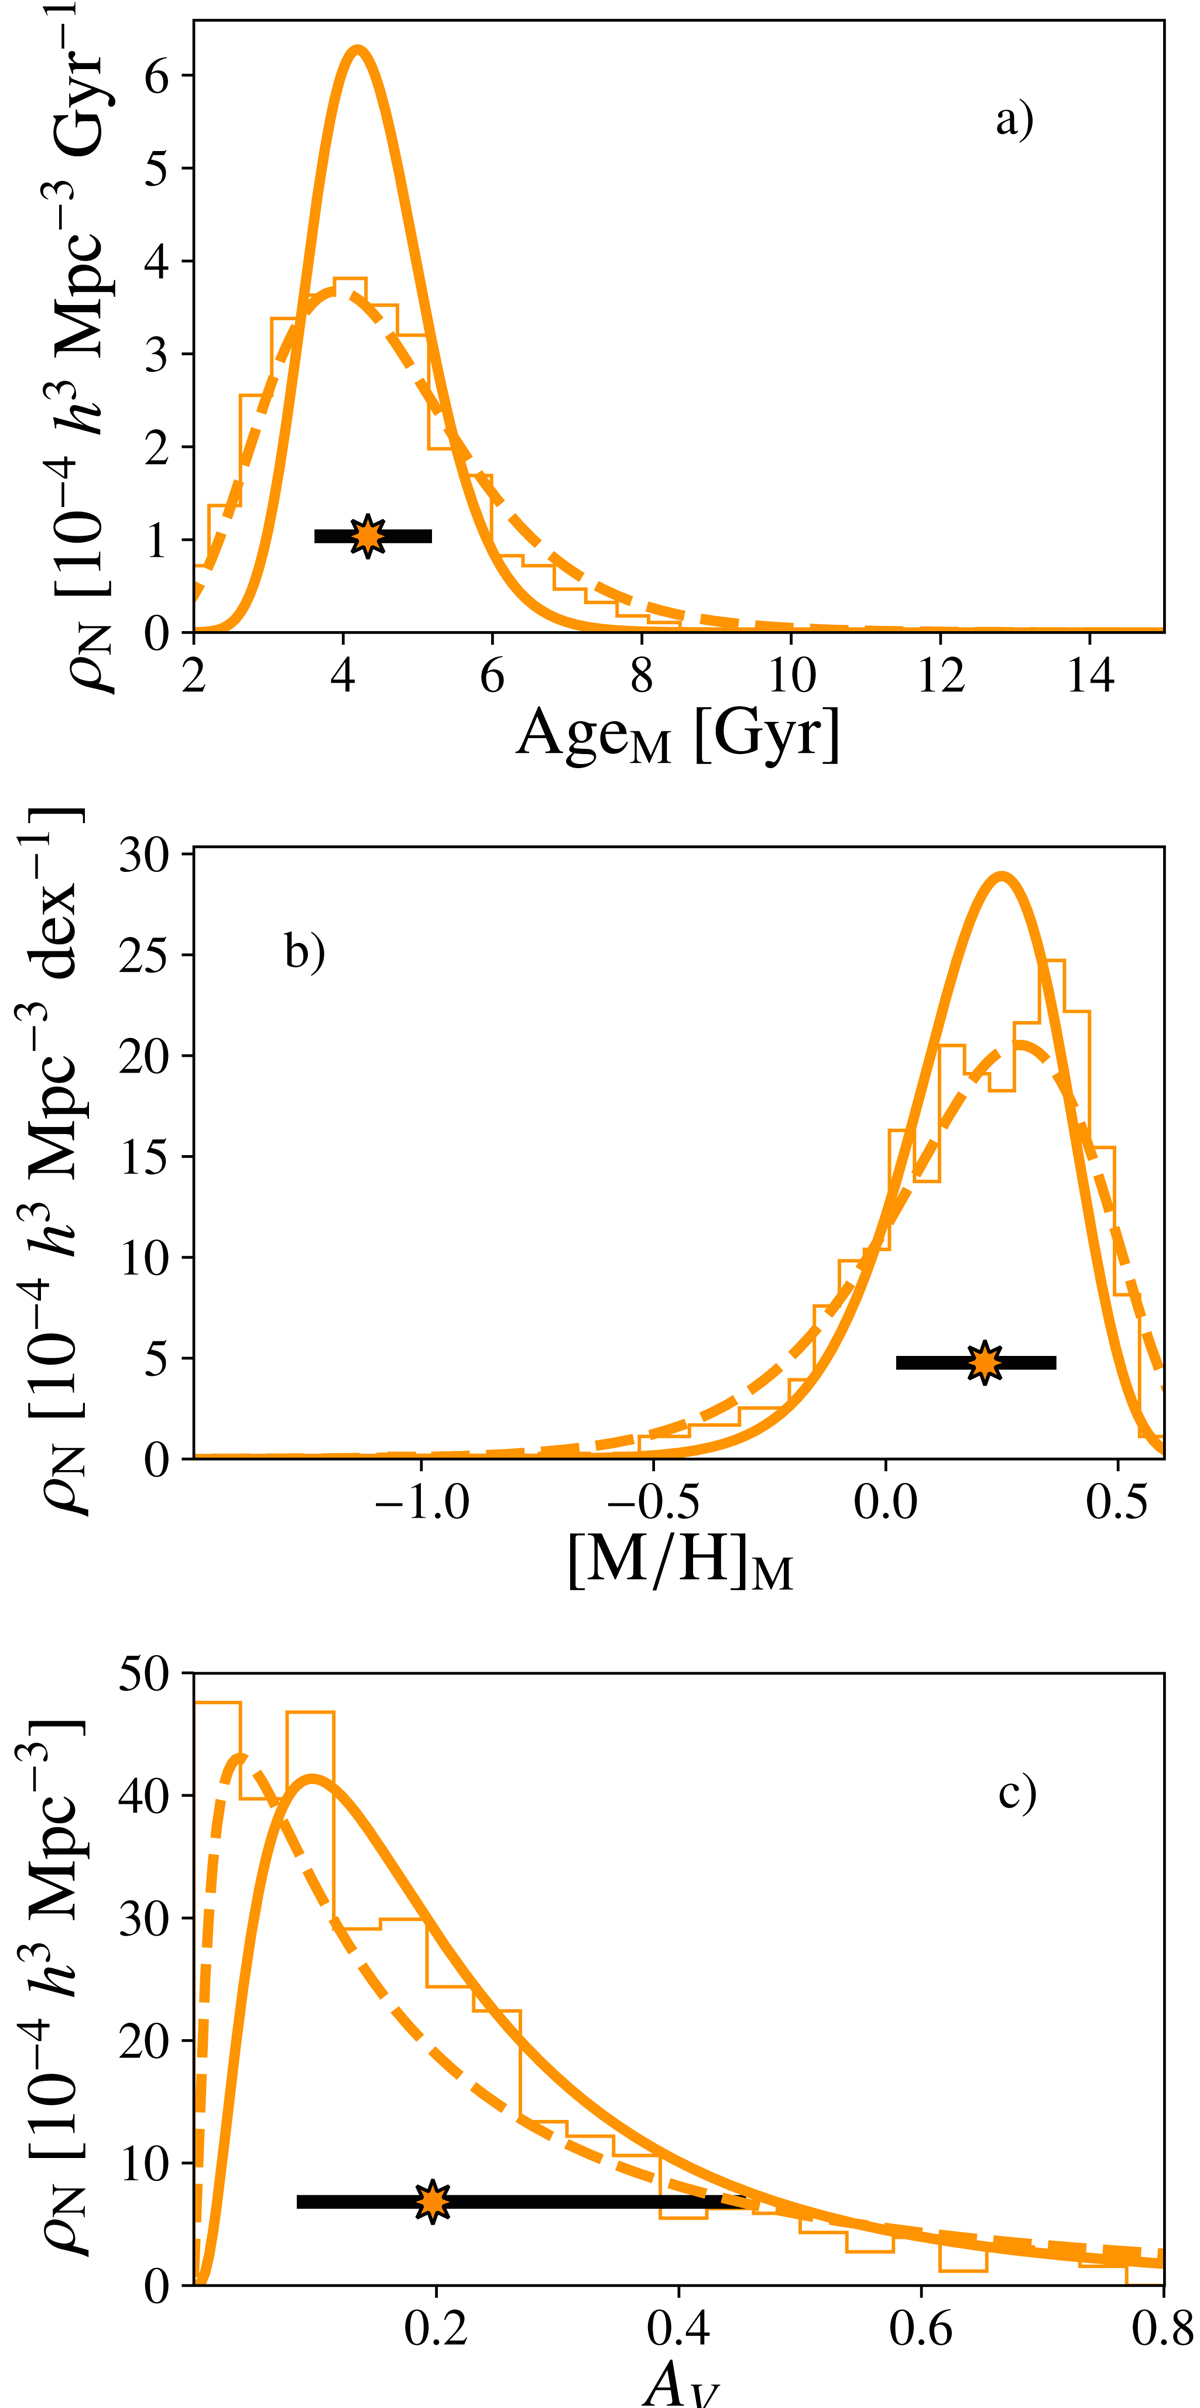
Histograms of stellar-population parameters (thin line, derived using BC03 SSP models) of the 1480 quiescent galaxies with stellar mass 10.8 ≤ log10 M⋆ < 11.2 dex and at redshift 0.5 ≤ z < 0.7. From top to bottom, mass-weighted age, mass-weighted metallicity, and extinction (panels a, b, and c, respectively). The dashed line is the distribution fit, whereas the solid orange line is the parameter distributions after applying the MLE method to deconvolve uncertainty effects (further details in the text). The star-shaped marker and the solid black line illustrate the median and the 1σ width of the distributions, respectively. All the curves were normalised to the fitted number density (see Sect. 3 and Table 2).
Current usage metrics show cumulative count of Article Views (full-text article views including HTML views, PDF and ePub downloads, according to the available data) and Abstracts Views on Vision4Press platform.
Data correspond to usage on the plateform after 2015. The current usage metrics is available 48-96 hours after online publication and is updated daily on week days.
Initial download of the metrics may take a while.